|

Mastercard Inc (NYSE: MA) enters extreme area

Mastercard Inc (NYSE: MA) is undergoing a weekly correction. Today, we dive into its technical chart. Our analysis explores the Elliott Wave structure and projected target for the current cycle.

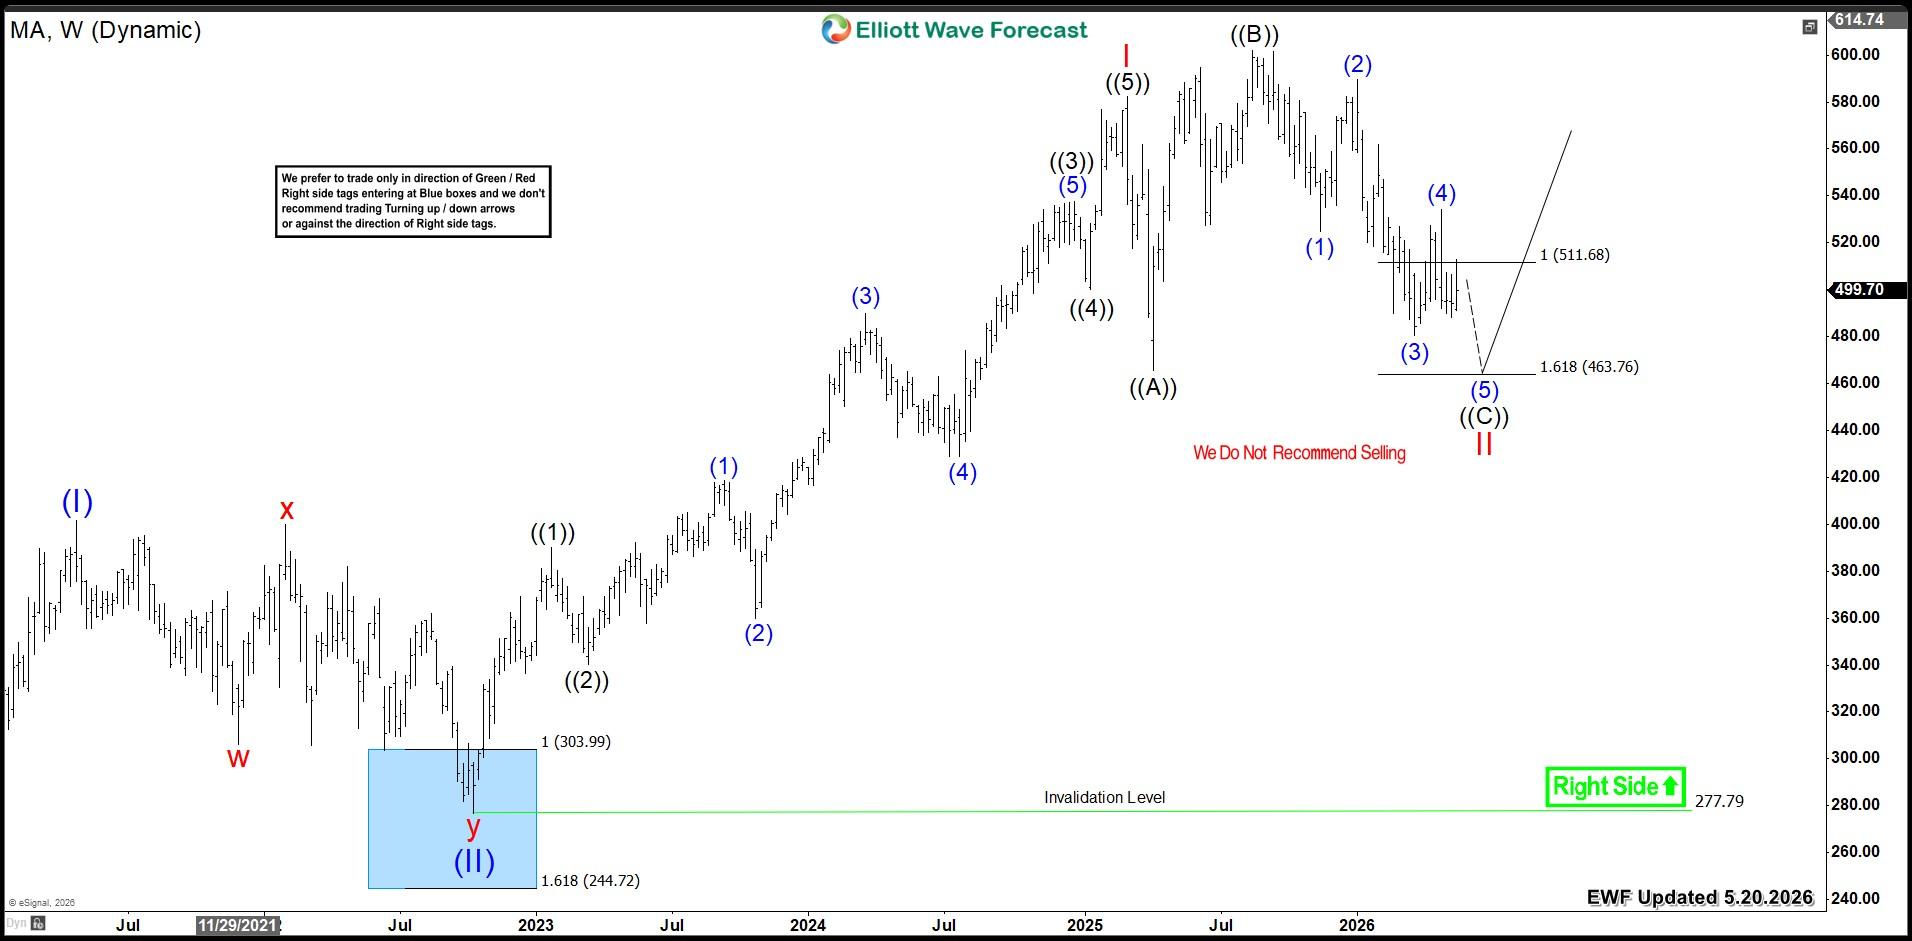
MA completed an impulsive five-wave advance from its 2022 low of 277.79. Wave I peaked at $582. From that high, a three-wave flat correction is now unfolding. Wave ((A)) ended at 465. Then, Then, wave ((B)) reached $601. Currently, wave ((C)) remains in progress.

The stock already reached the equal legs zone ( $511 − $463) . This area should conclude wave II. Consequently, a bullish reversal will take place from this zone and Mastercard will look to resume the rally higher in wave III into new all time highs.

Mastercard (MA) weekly chart 5.20.2026
Chart

Conclusion

Mastercard’s (MA) bullish cycle remains in progress. The stock is poised for further upside extension. Therefore, investors should target buying opportunities within weekly pullbacks.

Get More Insights Today

Learn to trade our Blue Boxes using the 3, 7, or 11 swings sequence. Try our services with a 14-day trial.

You will gain access to:

78 instruments updated across 4 different time frames.

Live Trading & Analysis Sessions with our Expert Analysts every day.

24-hour chat room support and much more.

Author

Elliott Wave Forecast Team

Elliott Wave Forecast Team

ElliottWave-Forecast.com

More from Elliott Wave Forecast Team
Share:

Editor's Picks

AUD/USD: Next on the upside is 0.7000

AUD/USD leaves behind Monday’s downtick and trades with marked gains, approaching the critical 0.7000 yardstick ahead of the opening bell in Asia on Wednesday. The pair’s solid performance follows the Greenback’s fresh downward trend amid cooling geopolitical tensions and caution ahead of the US CPI data.

USD/JPY extends retreat below 158.50 as intervention risks loom

USD/JPY is dropping below 158.50 in the Asian session on Tuesday, snapping a two-day winning streak and pulling back from an over two-week top touched the previous day, despite Japan's soft PPI inflation print. Bulls turn cautious amid speculation that authorities will step in to prop up the Japanese Yen, which, in turn, weighs on the pair.

Gold: Bears struggle to breach below $4,150

Gold now gives away its initial gains and resumes its decline, revisiting the $4,160 region per troy ounce on Tuesday. The precious metal’s pullback comes despite the fresh downward trend in the Greenback in combination with a mixed performance of US Treasury yields across the board and easing tensions on the geopolitical front.

HYPE falls to $80 as ETF outflows and flat volume weigh on Hyperliquid
Hyperliquid (HYPE) declines 4% on Tuesday, briefly touching $80 as perpetual volumes stay flat and institutional interest decreases. Perpetual volume on the platform saw a modest increase last week from $41.5 billion to $42.5 billion. The metric matters because 99% of fees Hyperliquid captures from trading volume flow toward token buybacks.
S&P 500 earnings just hit a record. The AI data centre bill hasn't landed yet
S&P 500 companies are on track for a third straight quarter of earnings growth above 25%, according to FactSet. Their profit margin hit 17% in the April-June quarter, the highest in FactSet data going back to 2009. The cash behind those earnings has been shrinking for two years, and almost all of the shrinkage is in the handful of companies building data centres for artificial intelligence (AI).
Has Bitcoin really escaped the macro forces it was built to fight?
Over 17 years ago, Satoshi Nakamoto designed Bitcoin (BTC) on the back of a global financial crisis as an alternative to the global monetary system outside the control of central banks, governments and traditional intermediaries. This raises a key question: has Bitcoin really become independent of the macroeconomic forces it was built to challenge?