IVZ is sitting right at the edge of a nine-month topping pattern: $21.86 is the number to watch

Invesco Ltd (IVZ) is a global investment firm that manages ETFs, mutual funds, institutional money across every major asset class. It's a name most market participants know well.
What they may not be watching closely enough right now is the daily chart, because the structure that has been forming on IVZ since last summer is about as clean a head and shoulders topping pattern as you're going to find, and price is sitting right at the neckline as I write this.
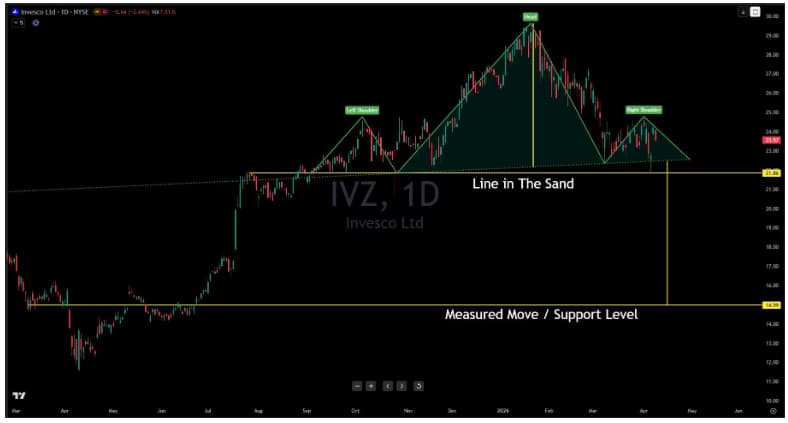
The head tagged close to $29.50 before rolling over hard. That was the high-water mark. What happened after is what caught my eye: buyers pushed back, made a recovery attempt, and got all the way back up to the $25 area where the left shoulder had formed. And then they ran out of gas. The right shoulder stalled right there and rolled back over, which left behind a chart full of traders who bought that recovery and are now sitting at a loss.
That supply is still overhead. It hasn't been absorbed, and it has been a ceiling on every rally attempt since.
Price is trading around $23.57 right now, which puts it directly on top of the neckline. This is the moment the pattern either confirms or it doesn't.
I'm watching $21.86 as the line in the sand. That's the level where, if we get a confirmed daily close below it, the setup is live. Not an intraday move, not a dip that recovers before the bell, an actual daily candle below on a closing basis.
The difference matters because intraday volatility will create false signals on a chart like this, and the traders who act before the daily close confirms the break are the ones who get shaken out right before the real move starts. Once that close happens below $21.86, the measured move from this formation points directly to $14.99. That target comes from taking the height of the pattern and projecting it down from the neckline. It also happens to sit right on top of a prior support level from earlier in IVZ's history. That confluence gives me confidence in the level as a realistic destination.
For the aggressive traders, a confirmed daily close below $21.86 is your trigger. If you want more behind you before acting, wait for a second session of follow-through. Just know you're giving up some of the move in exchange for that additional confirmation. Stop goes on a close back above the neckline.
Reclaiming $25 on a confirmed closing basis is what would put the bulls back in control of this chart. I'm not seeing anything right now that makes me think that's the more likely outcome.
IVZ has seen nine months of distribution, a clean pattern, and a neckline that's being tested right now. If $21.86 gives way on a confirmed close, this stock is heading to $14.99.
Author

Benjamin Pool
Verified Investing
A seasoned financial expert with a passion for empowering individuals to mastering smart money management.