IONQ aims for double correction lower against Dec 2022 lows

Quick summary IONQ’s weekly picture shows a large, multi‑leg corrective sequence resolving the cycle that began at the December 2022 low. The market completed a five‑wave advance into a larger degree top and is now working through a double‑three corrective decline. This post explains the structure in plain language, highlights the levels to watch, and recommends waiting to buy only after the correction completes and the weekly structure confirms a durable turn.
Weekly chart – Double three correction in progress
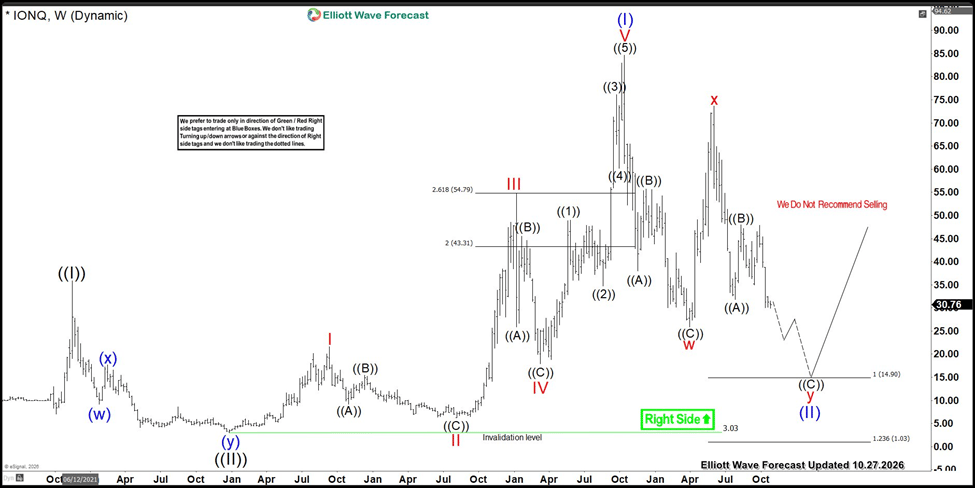
Chart headline — Complex corrective structure; wave y still unfolding
- The weekly count maps the cycle from the December 2022 trough. The prior advance developed as a contracting diagonal and completed a five‑wave sequence that finished the larger degree (I) near $84.64.
- Key pivots in the advance: Wave I ≈ $21.60, Wave II ≈ $6.22, Wave III ≈ $54.74, Wave IV ≈ $17.88, Wave V ≈ $84.64. That sequence completed the larger degree (I).
- The correction is labeled as a double three: w ended at $25.89, x bounced to $73.65, and y is still in progress and expected to push lower before the cycle from December 2022 is resolved.
What to expect next – Wait for the correction to finish before buying
Chart headline — Treat rallies as corrective until weekly structure flips
- A double‑three correction typically produces two corrective legs separated by a counter‑trend bounce. The x‑bounce to $73.65 was that mid‑cycle countertrend move; the ongoing y‑leg is expected to complete the correction.
- Practical takeaway: do not buy into rallies now. Instead, plan to buy only after the correction completes and the weekly chart shows consistent higher highs and higher lows.
Levels to monitor – Where buyers should prepare to act
Chart headline — Key reference points for a future buy zone
- Invalidation for the bearish count: sustained weekly close above $73.65 would weaken the double‑three thesis.
- Near‑term support: current weekly lows around the present price area — watch price behavior there for signs of exhaustion.
- Target zone for the y‑leg completion:1.03 (the projected area where the corrective sequence may finish).
- Confirmation for buyers: look for a decisive weekly close above the most recent impulsive high and a clear sequence of weekly higher highs and higher lows before initiating new long positions.
Trade plan – Buy only at the end of the correction, with rules
Chart headline — A patient, risk‑defined approach for buyers
- Bias: Neutral-to-bullish only after the correction completes; bearish structure remains until then.
- Buy trigger: Enter long only after the weekly structure confirms the end of wave y — defined by consistent weekly higher highs and higher lows and momentum/volume confirmation.
- Entry technique: When the correction completes, prefer buying into a blue‑box or measured low with a clear invalidation level. Use swing sequencing (3, 7, 11 swings) on lower timeframes to refine entries.
- Stops: Place stops below the structural invalidation for your chosen count; keep stops logical and tied to the wave structure.
- Targets and scaling: Scale into positions; set initial profit targets at logical resistance levels and tighten stops as the trend confirms.
- Risk management: Keep position sizes conservative, use defined stop‑losses, and avoid holding through major events that can widen ranges.
How to know the correction is over
Chart headline — Clear signs that buying is appropriate
- Weekly price begins to form consistent higher highs and higher lows.
- A decisive weekly close above the recent impulsive high and the invalidation level at $73.65.
- Momentum and volume confirm the turn (weekly RSI divergence resolving and stronger volume on up weeks).
- Once these conditions are met, buyers can shift from “wait” to “buy” with clearly defined risk.
Why this matters
IONQ is a volatile, sentiment‑driven stock. Waiting for the correction to finish avoids chasing failed rallies and lets you buy with defined risk at structurally favorable levels. The Elliott Wave framework doesn’t promise exact timing, but it maps where the structure is likely to complete so you can plan disciplined entries, stops, and position sizing.
Author

Elliott Wave Forecast Team
ElliottWave-Forecast.com