|

Intel’s (INTC) revenge: How the underdogs are finally winning the AI war

The current trajectory of the semiconductor market suggests a significant “changing of the guard” in the AI sector, as capital rotates from the first-wave GPU dominance of Nvidia into the foundational infrastructure plays of Intel (INTC) and AMD. This shift is not merely a product of market sentiment but is deeply reflected in the technical structures of the current rally. From an Elliott Wave perspective, Intel appears to be transitioning out of a multi-year corrective phase and into a powerful Wave 3 rally, driven by the structural validation of its strategies and landmark foundry agreements. Our INTC blog back in  2020, called for the same rally to take place and it is finally happening 4-5 years later. Let’s take a look at the montly and daily charts to dissect the most recent rally.

INTC (Intel) long-term Elliott Wave analysis

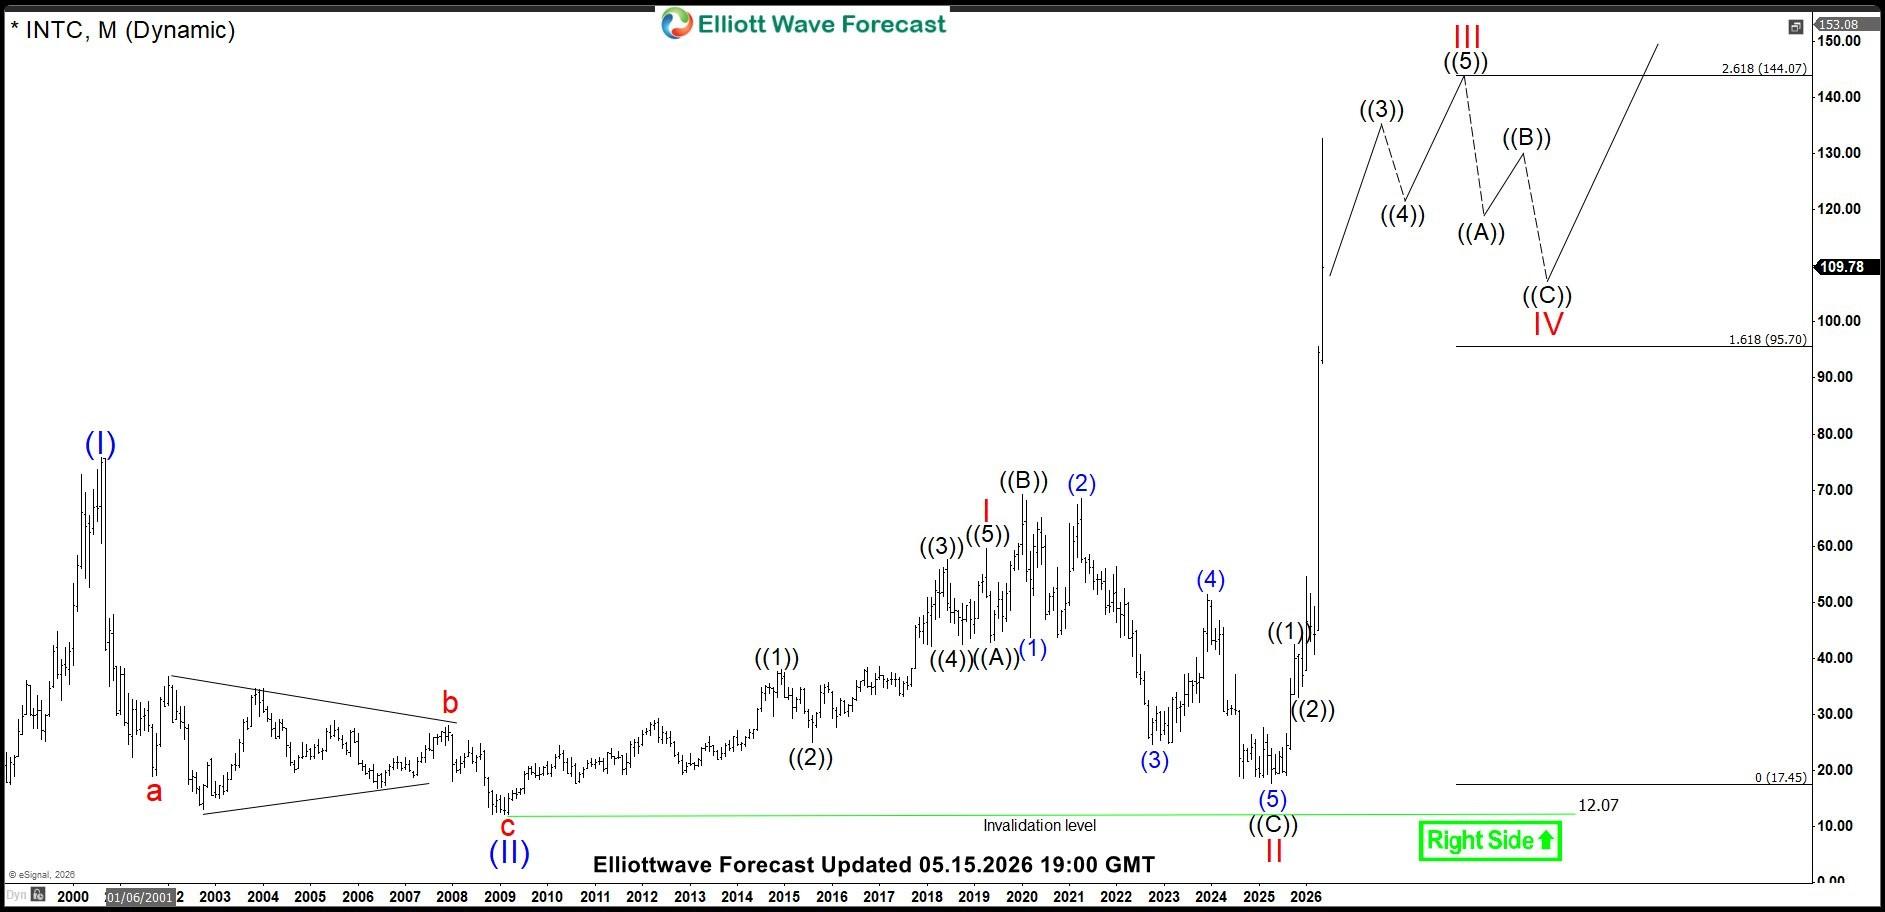
INTC (Intel) ended a major correction back in 2009 and rallied impulsively to a high of $59.59 in April 2019. We labelled this rally as wave I of a bullish wave (III). It then started a pull back which took the form of an expanded FLAT Elliott wave correction and retraced more than 76.4% of wave I rally. Wave II completed back in April 2025 and since then it has gained over 700% and appears to be still within wave ((3)) or within wave ((4)) of III. 261.8% Fibonacci extension of wave I – II comes at 144.07 and is the ideal area to complete wave III.
Chart

INTC (Intel) daily chart Elliott Wave analysis

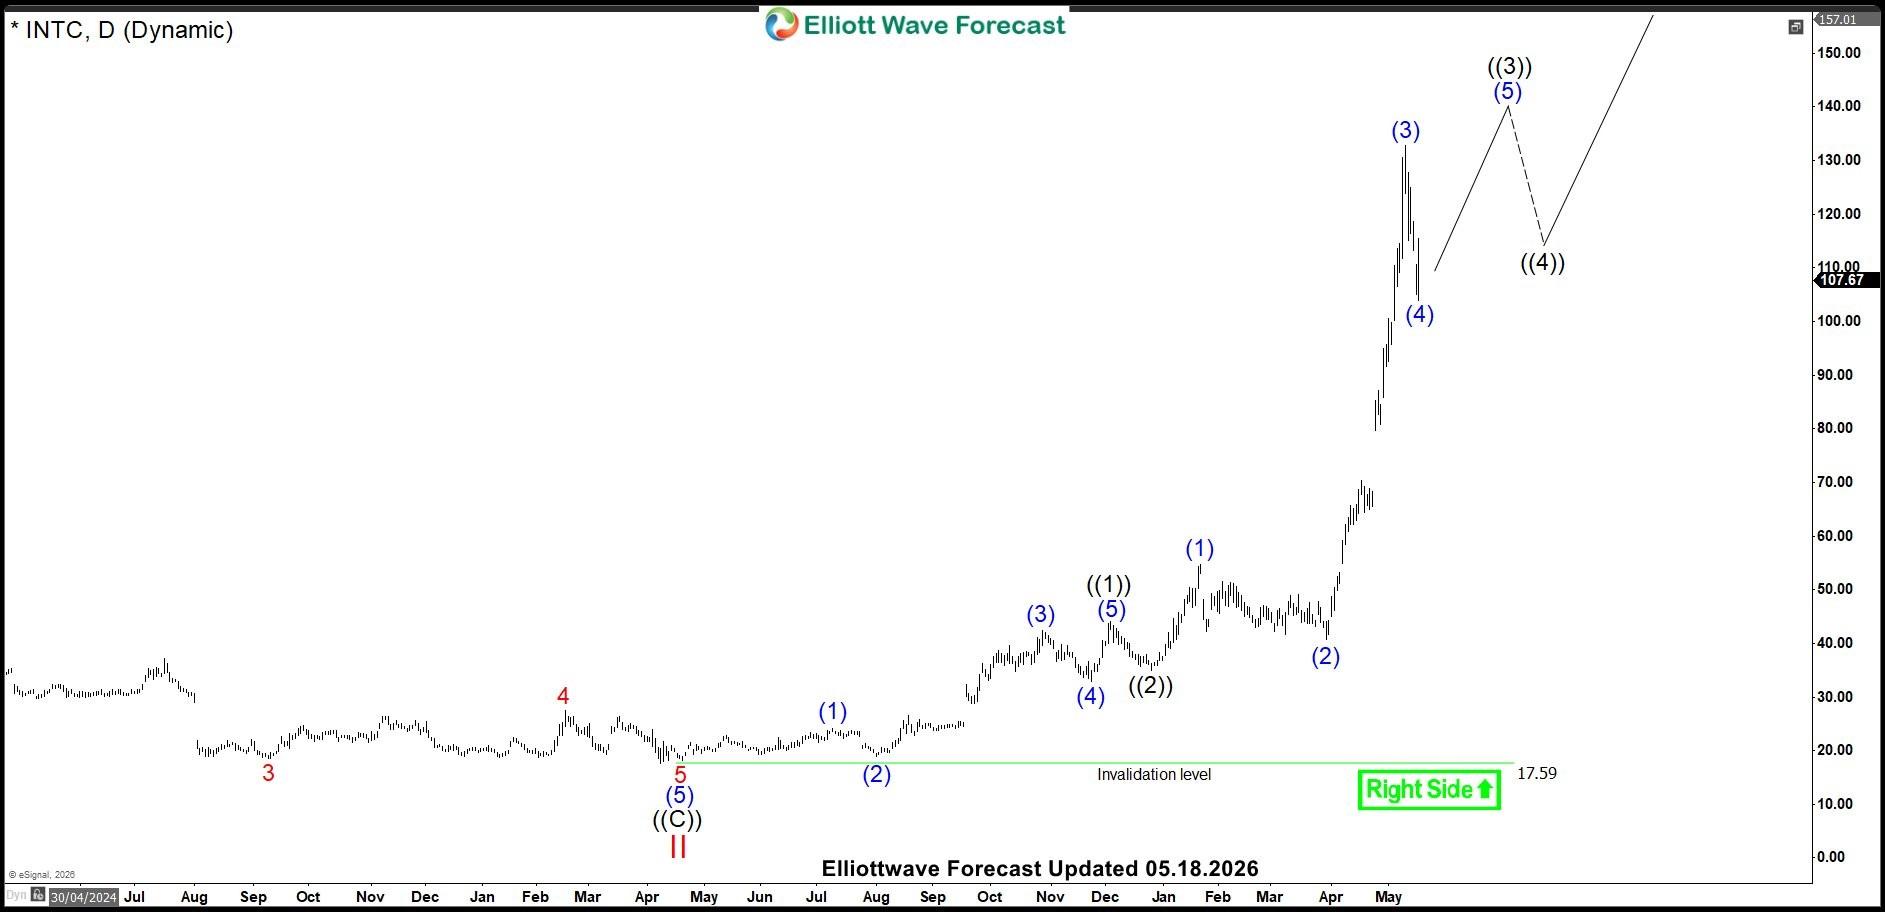
Daily chart of Intel below shows structure of the rally up from April 2025 wave II low. Wave ((1)) ended at $43.28, wave ((2)) completed at $34.95, wave (1) of ((3)) completed at $54.60, wave (2) of ((3)) completed at $40.63, wave (3) of ((3)) completed at $132.75 and we are currently in wave (4) pull back, once completed, it should look for a new high to end wave ((3)) before pulling back in wave ((4)) and resuming the rally to complete the cycle from April 2025 low.
Chart

2026 performance (Year-To-Date)

We can see Intel (INTC) has gained 240% Year-to-date and is in 2nd place behind Micron (MU) which has gained 750% year-t0-date whereas NVDA is in  last place having gained only 15% year-t0-date due to saturated market and China not buying advanced NVDA chips despite US government clearance

Author

Elliott Wave Forecast Team

Elliott Wave Forecast Team

ElliottWave-Forecast.com

More from Elliott Wave Forecast Team
Share:

Editor's Picks

GBP/USD holds losses below 1.3550 after weak UK jobs data

GBP/USD holds losses below 1.3550 in European trading hours on Tuesday. The UK ILO Unemployment Rate held steady at 4.9% in the three months to June, against a forecast of 4.8%, while Employment Change arrived at 83K in the same period versus 147K previous. Weak UK labor data keep the British Pound under pressure, driving the pair lower.

EUR/USD stays below 1.1600 despite upbeat sentiment data

EUR/USD struggles to gain traction and trades below 1.1600 in the European session on Tuesday, even after the data from the Eurozone and Germany highlighted improving economic sentiment in August. The US Dollar (USD) benefits from the risk-averse market atmosphere as tensions in Middle East remain high, making it difficult for the pair to turn north.

Gold sticks to losses below $4,400 as USD recovers further from two-month low

Gold remains depressed below the $4,400 mark through the first half of the European session, snapping a two-day winning streak amid a broadly firmer US Dollar. Inflation risks stemming from higher oil prices back the case for at least one interest rate hike by the US Federal Reserve in 2026.

Ripple and Stellar remain under bearish pressure as corrective declines cap upside

Ripple and Stellar remain under pressure as broader market uncertainty and weak technical momentum weigh on both altcoins. XRP is hovering below the key $1 mark on Tuesday while XLM continues its corrective decline below $0.157. Meanwhile, mixed derivatives and on-chain signals indicate cautious sentiment, leaving both cryptocurrencies vulnerable to further downside.

Fiscal concerns and doubts on Fed independence send US yields to long-term highs

US Treasury yields keep rising across the curve this week, with the yield for the 30-year Treasury bond reaching its highest level since 2007, during the global financial crisis, at 5.33% so far on Monday. A mix of concerns about the ballooning US fiscal deficit and growing doubts about the Federal Reserve’s Independence are increasing pressure on US Government Bonds.

Why is Crude Oil priced for a reopening the ships haven't made?
Fourteen vessels crossed the Strait of Hormuz on Tuesday. Before the war, the count ran near 120 a day. In the sessions since the waterway was publicly declared open, Brent has drifted back to $87 and West Texas Intermediate (WTI) to $81, both a little lower again on Wednesday, with daily momentum on each unwound from the top of its range in late July to the low twenties now.
















