Indian Rupee rebounds on likely RBI's intervention, India's retail CPI rises in July
- The Indian Rupee recovers against the US Dollar due to likely RBI intervention.
- India's retail inflation rises to 4.45% YoY in July, almost matching expectations of 4.5%.
- Investors keenly await the US CPI data for July.
The Indian Rupee (INR) recovers early losses against the US Dollar (USD) on Wednesday due to likely Reserve Bank of India's (RBI) intervention in the market. At press time, USD/INR trades slightly lower to near 95.33.
While dollar sales from state-run banks - most likely on behalf of the RBI - kept a lid on losses, caution heading into key United States (US) inflation print and worries over higher oil prices contained the room for gains, traders said, Reuters reported.
The Indian currency underperformed in the opening session as surging oil prices prompt risks of higher foreign outflows, which are still intact. As of writing, the MCX Crude Oil contract expiring on August 19 trades flat at around Rs. 7,950, but is close to its weekly high of Rs. 8,075 posted on Tuesday.
Currencies from economies, such as India, which rely heavily on oil imports to meet their energy needs, tend to underperform in a high-oil-price environment.
Restricted energy supply continues to boost oil prices
A prolonged oil supply disruption due to the closure of the Strait of Hormuz, a critical chokepoint to almost one-fifth of global energy supply, amid tensions between the United States (US) and Iran continues to boost oil prices.
According to data from Kpler, shipping traffic through the Strait of Hormuz, a vital passage to almost 20% of global energy supply, was recorded at just six vessels on August 10, down from a recent 10-day average of about 11. This remains a massive decline from pre-war levels of 130 to 140 ships daily, Reuters reports.
Meanwhile, mediators from Pakistan have expressed optimism regarding progress in negotiations between the US and Iran. Pakistan’s Defence Minister, Khawaja Asif told reporters that “things are shaping up again in favor of a peace arrangement or a deal, according to Bloomberg.
India's retail inflation rises in July
India’s retail Consumer Price Index (CPI) data for July grew almost in line with estimates. On an annualized basis, retail inflation accelerated to 4.45%, remaining within the RBI's tolerance band of 2%-6%, from 4.35% in June. The data was expected to arrive at 4.5%. Signs of steady inflation growth are unlikely to force RBI officials to consider raising interest rates in the near term.
In the monetary policy announcement earlier this month, the RBI left its key policy rates unchanged and delivered a data-dependent approach. Indian central bank trimmed its inflation forecast for the current financial year to 5% from 5.1% projected in June.
US CPI data awaited
The major highlight for global financial markets will be the US inflation data, which will be published at 12:30 GMT. The inflation data is expected to have a significant influence on the Federal Reserve’s (Fed) monetary policy outlook. In the July policy meeting, remarks from Fed Chairman Kevin Warsh clearly showed that officials are heavily concerned about inflationary pressures remaining well above the central bank’s 2% target for a long period.
US inflation seen firming but not reaccelerating in July
Brown Brothers Harriman’s Elias Haddad expects the upcoming US July CPI report to show inflation "firm modestly but stop short of signaling a renewed acceleration in inflation." He notes that "headline CPI is expected to rise +0.1% m/m vs. -0.4% in June and ease to 3.4% y/y vs. 3.5% in June," while "core CPI is expected to rise +0.2% m/m vs. 0.0% in June and ease to 2.5% y/y vs. 2.6% in June." Haddad argues that such a profile would underscore a gradual disinflation trend rather than a renewed pickup in price pressures.
Technical Analysis: USD/INR faces pressure near 20-day EMA
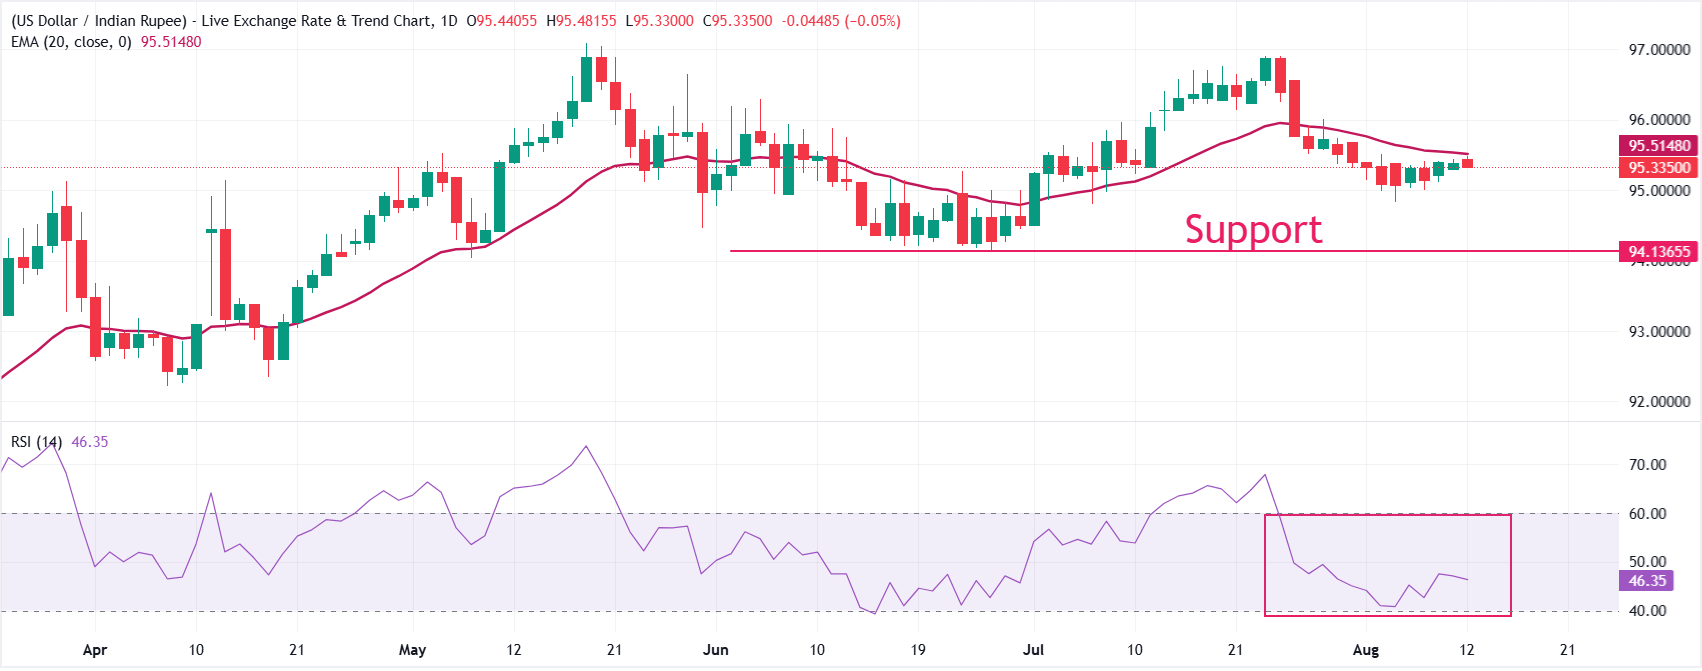
USD/INR struggles to return above the 20-day exponential moving average (EMA) at 95.52, hinting at the strength of Indian Rupee bulls.
The Relative Strength Index (14) around 46 hints at soft, range-bound momentum rather than aggressive selling pressure.
On the topside, immediate resistance is located at the 20-day EMA near 95.52, which would need to be decisively reclaimed to ease the current downside bias and open the way for a further recovery move toward 96.00. Looking down, key support zones are the August 5 low at 94.83 and the June low at 94.15.
(The technical analysis of this story was written with the help of an AI tool. Know more.)
Economic Indicator
Consumer Price Index (YoY)
Inflationary or deflationary tendencies are measured by periodically summing the prices of a basket of representative goods and services and presenting the data as The Consumer Price Index (CPI). CPI data is compiled on a monthly basis and released by the US Department of Labor Statistics. The YoY reading compares the prices of goods in the reference month to the same month a year earlier.The CPI is a key indicator to measure inflation and changes in purchasing trends. Generally speaking, a high reading is seen as bullish for the US Dollar (USD), while a low reading is seen as bearish.
Read more.Next release: Wed Aug 12, 2026 12:30
Frequency: Monthly
Consensus: 3.4%
Previous: 3.5%
Source: US Bureau of Labor Statistics
The US Federal Reserve (Fed) has a dual mandate of maintaining price stability and maximum employment. According to such mandate, inflation should be at around 2% YoY and has become the weakest pillar of the central bank’s directive ever since the world suffered a pandemic, which extends to these days. Price pressures keep rising amid supply-chain issues and bottlenecks, with the Consumer Price Index (CPI) hanging at multi-decade highs. The Fed has already taken measures to tame inflation and is expected to maintain an aggressive stance in the foreseeable future.
Author

Sagar Dua
FXStreet
Sagar Dua is associated with the financial markets from his college days. Along with pursuing post-graduation in Commerce in 2014, he started his markets training with chart analysis.















