Hyperliquid Price Forecast: HYPE eyes $50 breakout despite platform revenue, DeFi TVL cooling
- Hyperliquid extends gains for a fourth consecutive day, holding above $41.00 on Friday.
- Hyperliquid DEX daily platform revenue and DeFi TVL shrink to $2.25 million and $4.9 billion, respectively.
- HYPE maintains a bullish outlook supported by major uptrending moving averages and key momentum indicators.

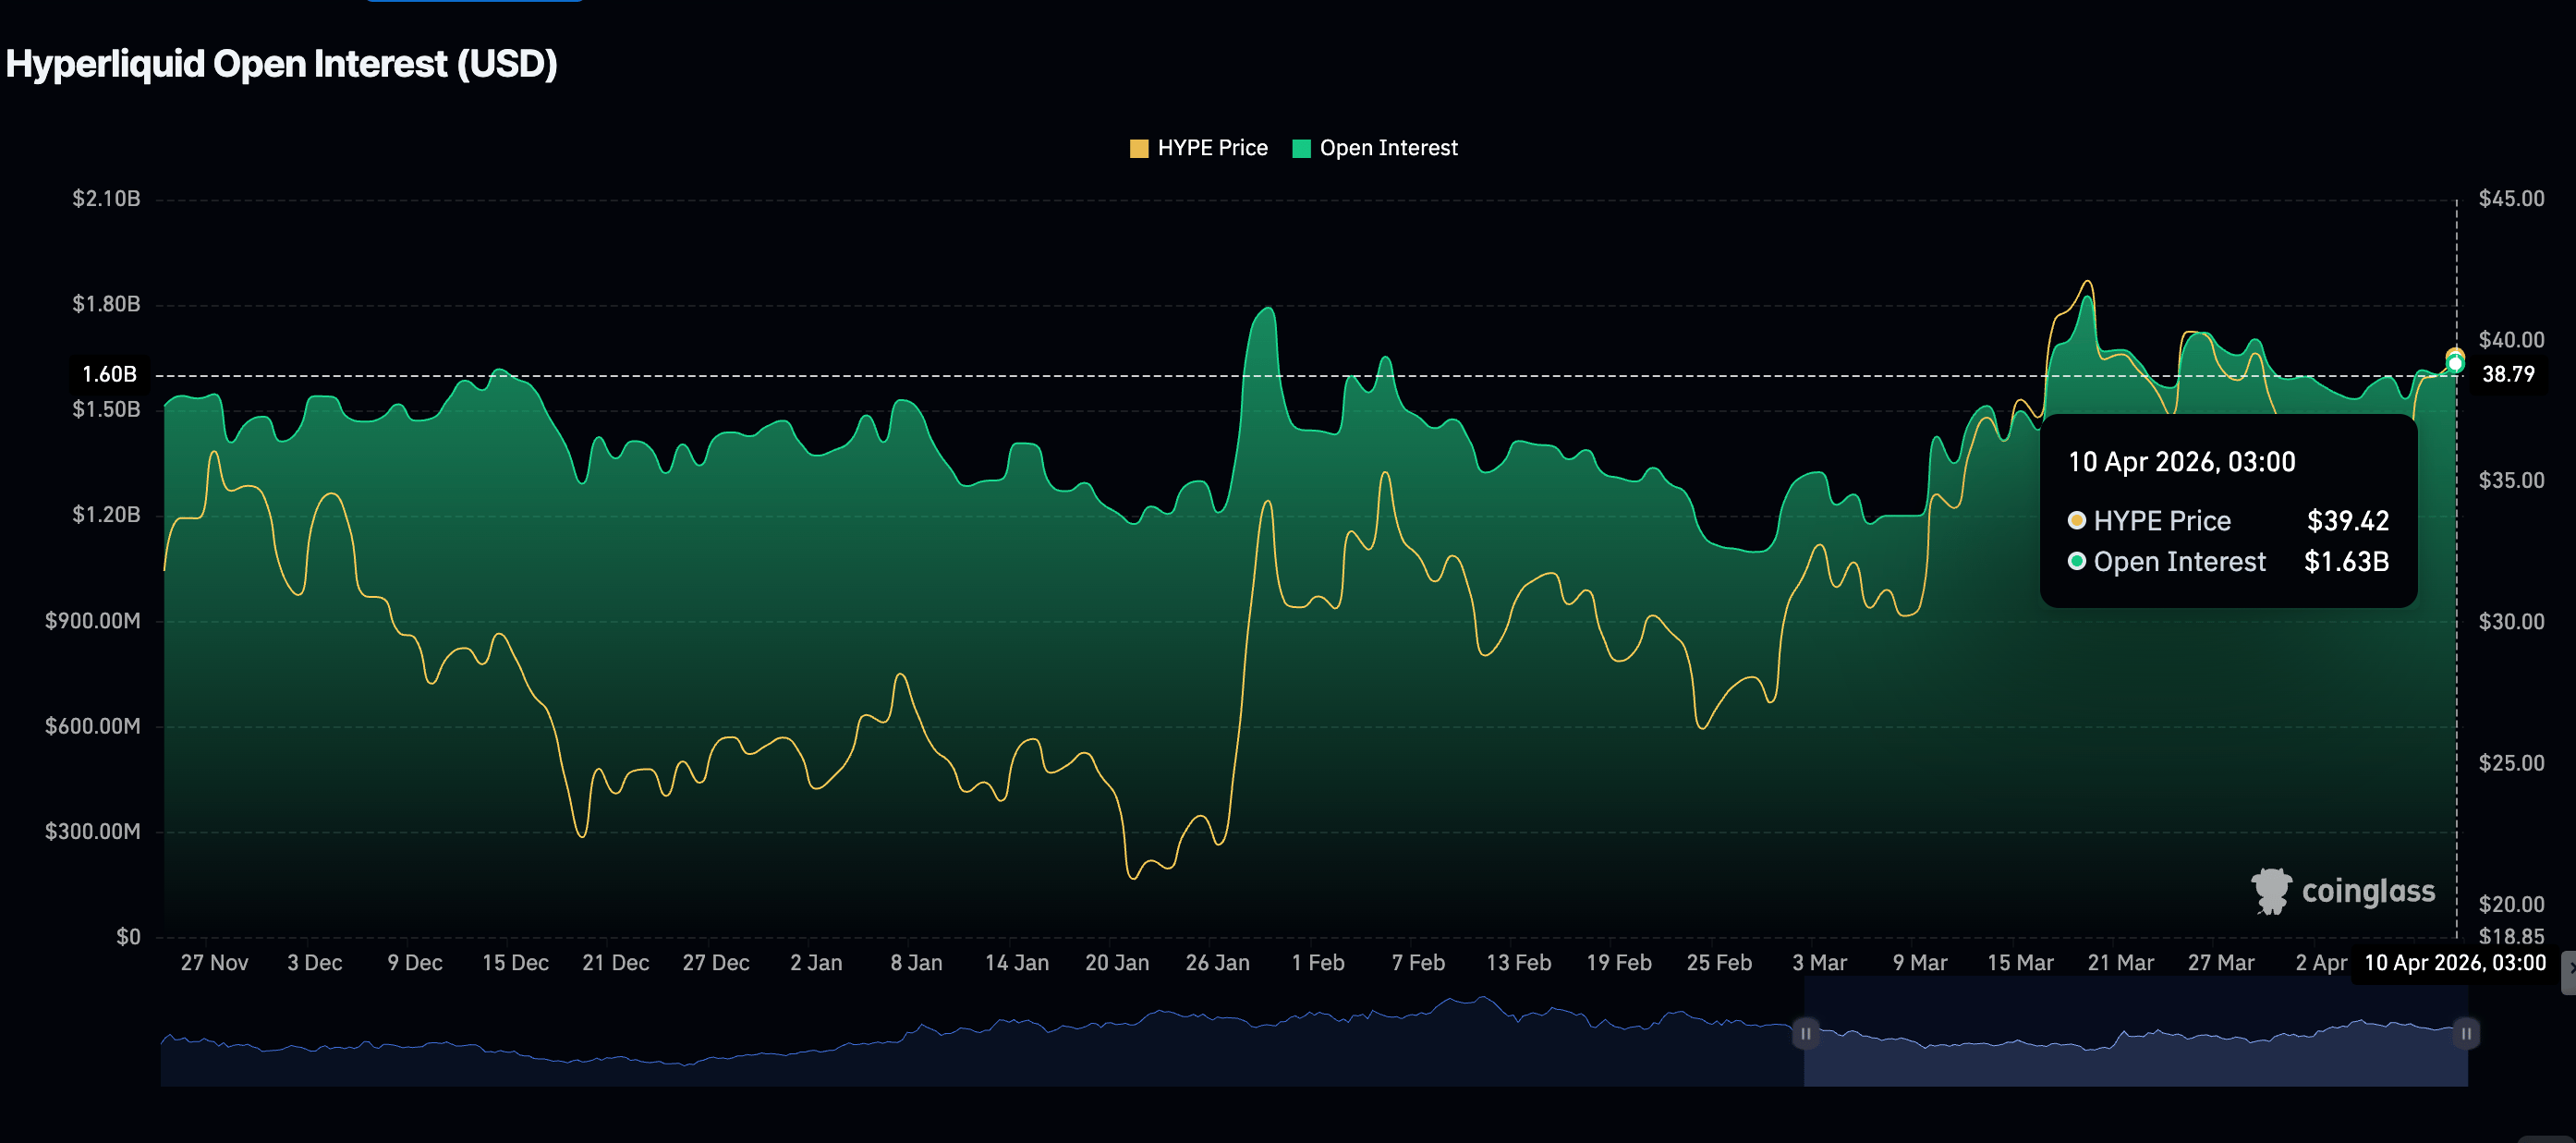
Hyperliquid (HYPE) edges up above $41.00 at the time of writing on Friday, buoyed by improving sentiment around the native Decentralized Exchange (DEX) token. Retail demand remains steady amid HYPE’s bullish outlook, with futures Open Interest (OI) rising to $1.63 billion on Friday, from $1.60 billion the previous day.
Hyperliquid revenue and DeFi TVL fade as price climbs
Hyperliquid Decentralized Finance (DeFi) Total Value Locked (TVL) is steady at $4.93 billion on Friday after peaking at $5.07 billion on Wednesday. TVL reflects the notional value of all the coins held across the protocol’s smart contracts.
A persistent decline in TVL suggests investors are withdrawing assets from the protocol, indicating an intent to sell. This increases available supply for sale, which could dampen HYPE’s recovery.
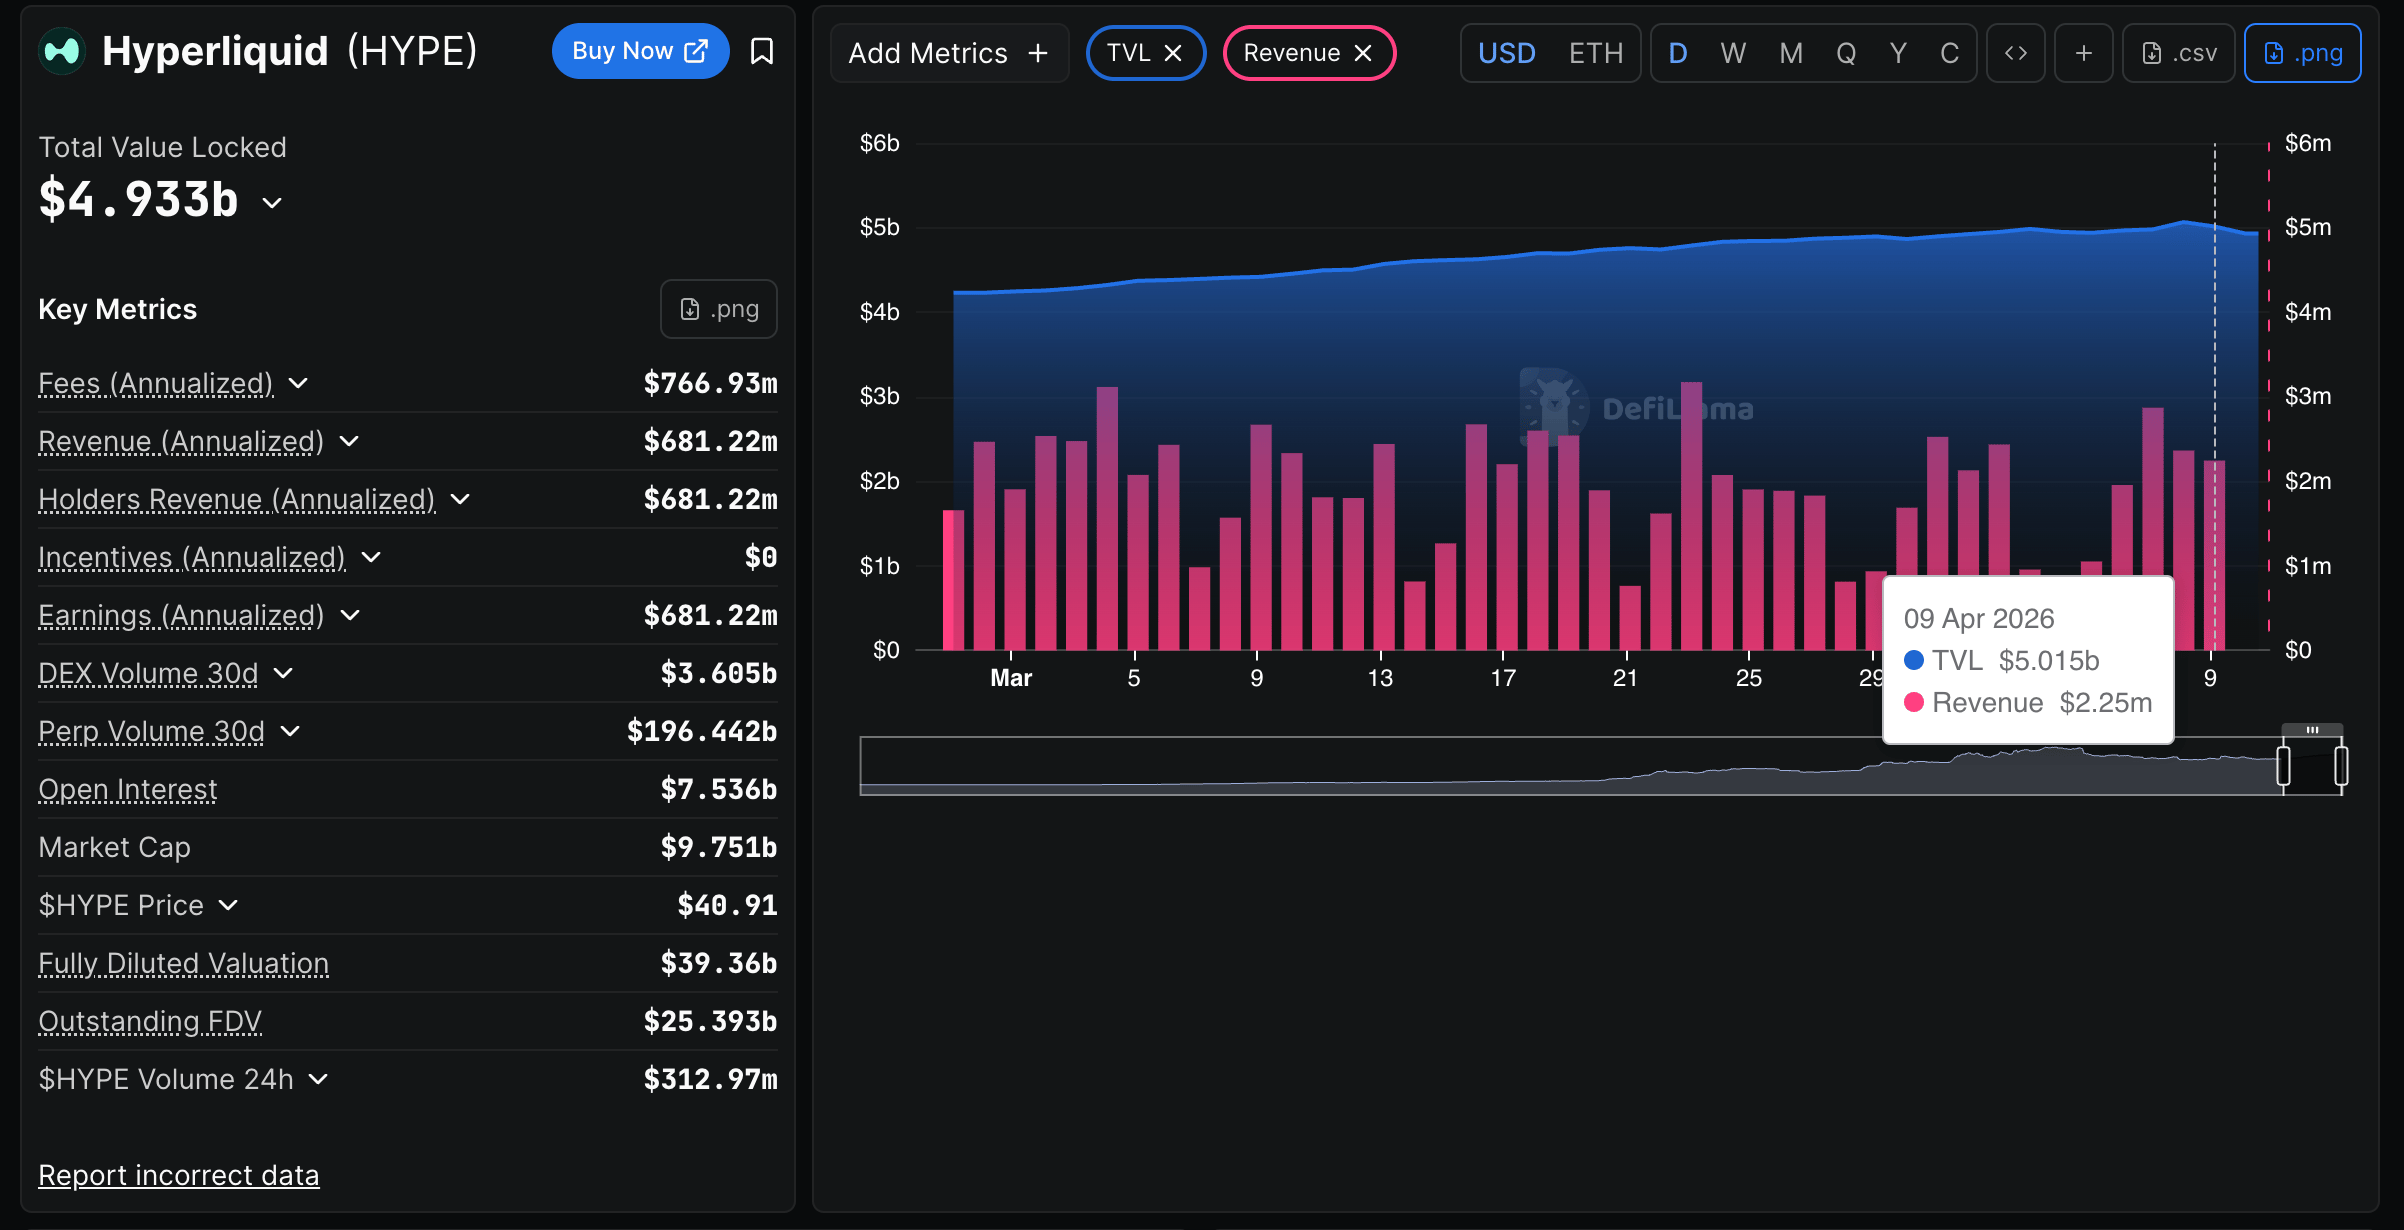
Meanwhile, the DEX revenue has softened over the last few days, averaging $2.25 million on Thursday, down from $2.36 million the previous day. DefiLlama data shows that revenue peaked at $2.87 million on Tuesday, suggesting user activity on the exchange platform is declining.
Chart of the day: Hyperliquid tests recovery strength targeting $50.00
Hyperliquid hovers at $41.09, well above the 50-day and 100-day Exponential Moving Averages (EMAs), currently around $35.77 and $32.73, respectively, reinforcing a constructive bullish bias as it rides a broader rising structure defined by two ascending trendline supports.
Momentum also leans positive, with the Moving Average Convergence Divergence (MACD) indicator back in positive territory on the daily chart and the Relative Strength Index hovering near 65, suggesting persistent buying pressure but still shy of outright overbought conditions.
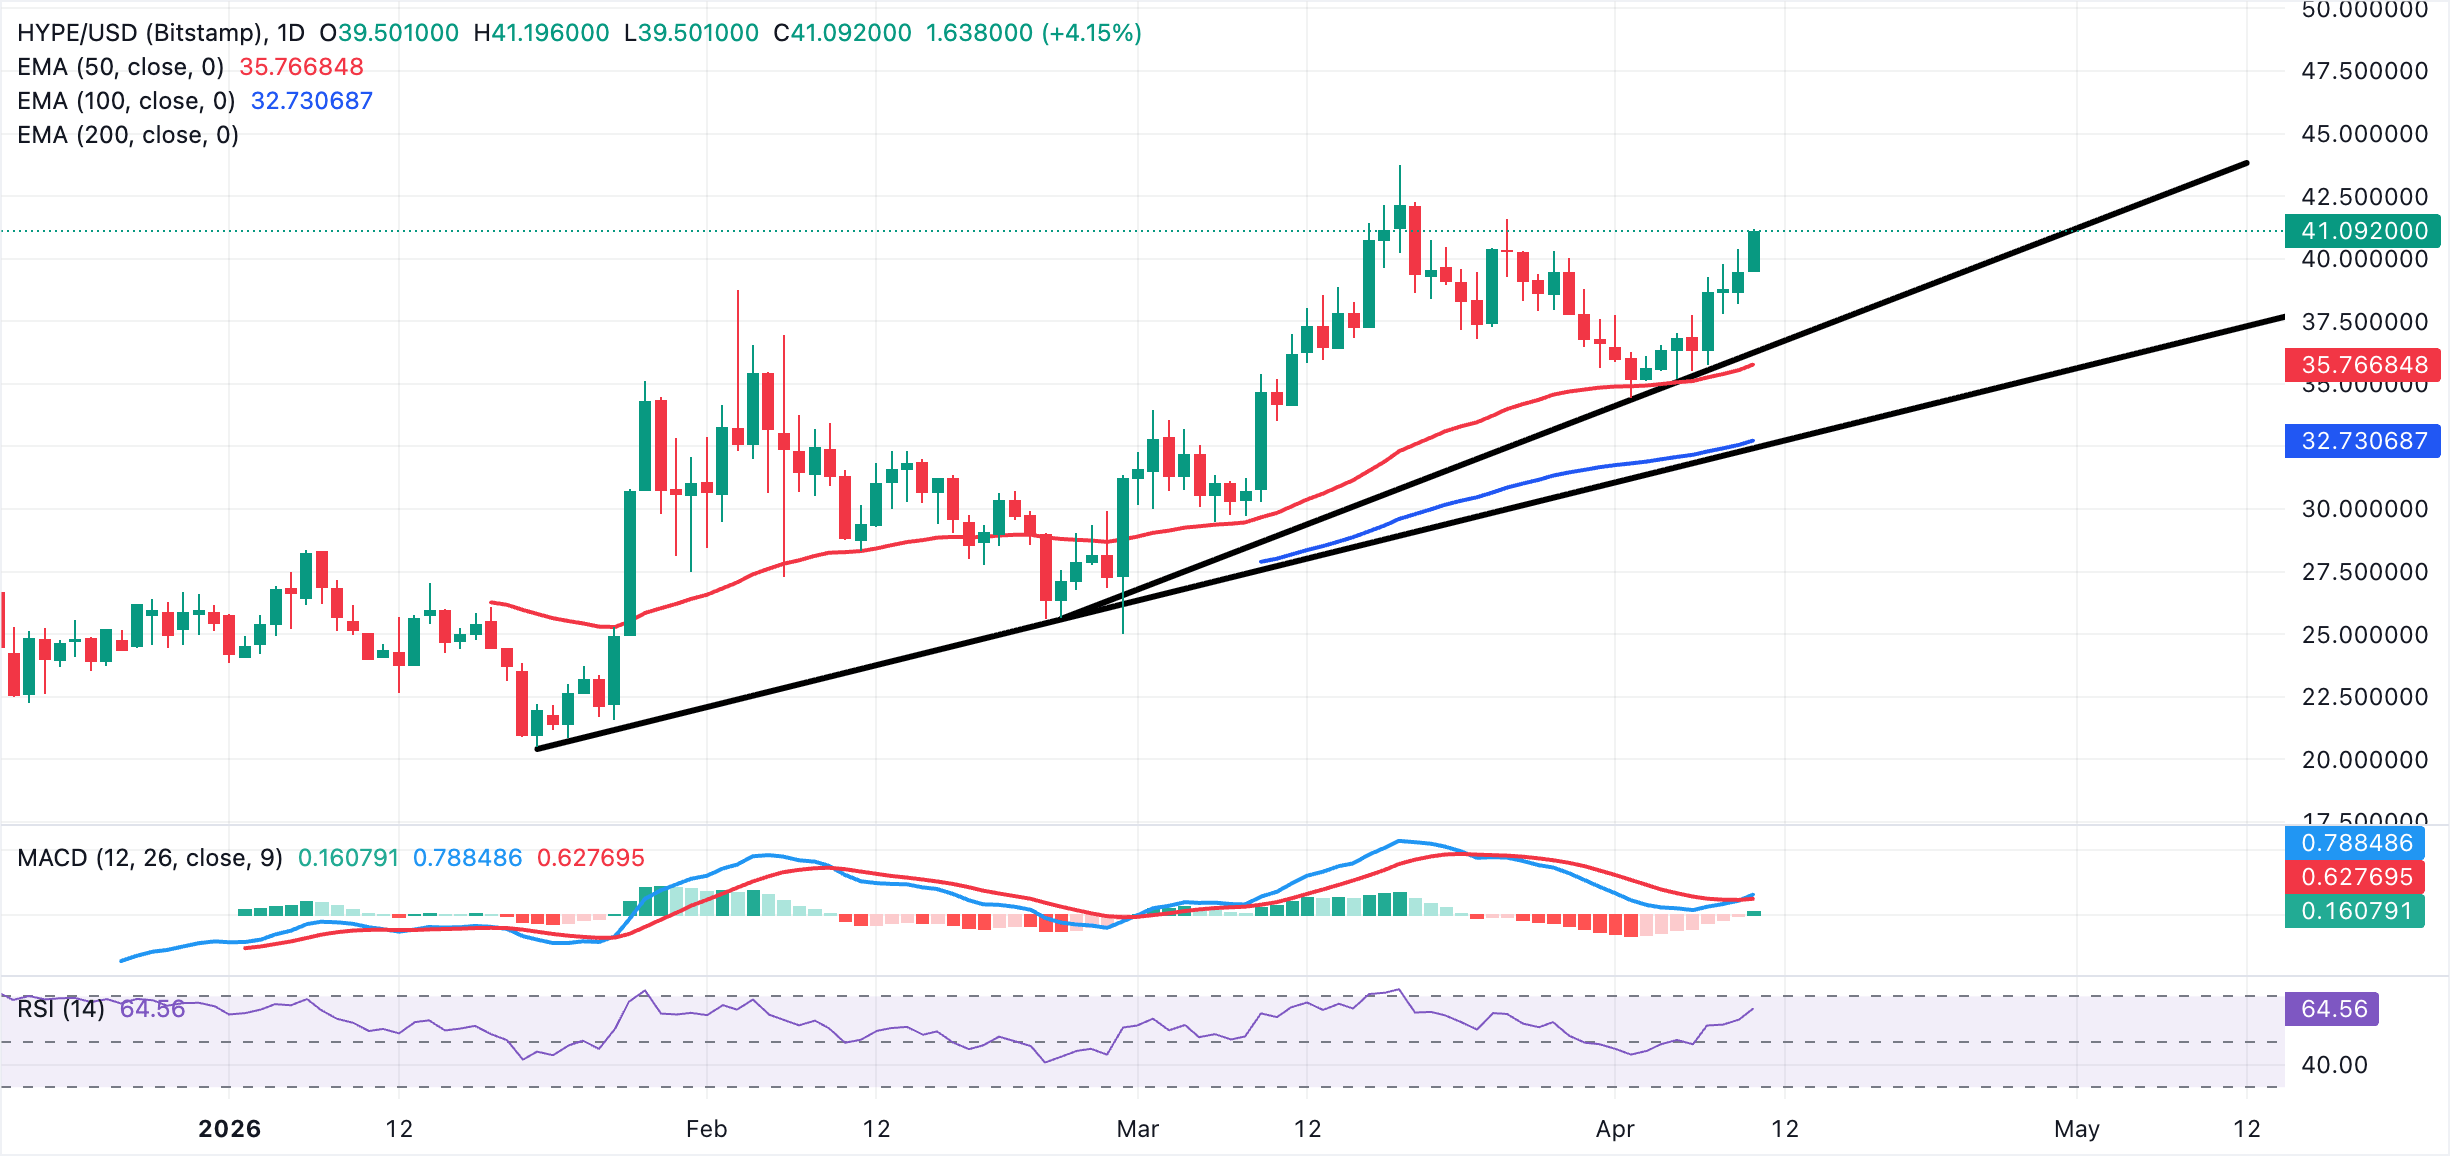
On the downside, HYPE's initial support is seen near the accelerated trendline break area around $36.37, which is closely backed by the 50-day EMA at $35.77. A deeper pullback would expose the 100-day EMA at $32.73, which converges with the main trendline around $32.51 as a more strategic demand zone where dip buyers could look to re-enter, while the broader uptrend remains intact above these levels.
Cryptocurrency metrics FAQs
The developer or creator of each cryptocurrency decides on the total number of tokens that can be minted or issued. Only a certain number of these assets can be minted by mining, staking or other mechanisms. This is defined by the algorithm of the underlying blockchain technology. On the other hand, circulating supply can also be decreased via actions such as burning tokens, or mistakenly sending assets to addresses of other incompatible blockchains.
Market capitalization is the result of multiplying the circulating supply of a certain asset by the asset’s current market value.
Trading volume refers to the total number of tokens for a specific asset that has been transacted or exchanged between buyers and sellers within set trading hours, for example, 24 hours. It is used to gauge market sentiment, this metric combines all volumes on centralized exchanges and decentralized exchanges. Increasing trading volume often denotes the demand for a certain asset as more people are buying and selling the cryptocurrency.
Funding rates are a concept designed to encourage traders to take positions and ensure perpetual contract prices match spot markets. It defines a mechanism by exchanges to ensure that future prices and index prices periodic payments regularly converge. When the funding rate is positive, the price of the perpetual contract is higher than the mark price. This means traders who are bullish and have opened long positions pay traders who are in short positions. On the other hand, a negative funding rate means perpetual prices are below the mark price, and hence traders with short positions pay traders who have opened long positions.
(The technical analysis of this story was written with the help of an AI tool.)
Author

John Isige
FXStreet
John Isige is a seasoned cryptocurrency journalist and markets analyst committed to delivering high-quality, actionable insights tailored to traders, investors, and crypto enthusiasts. He enjoys deep dives into emerging Web3 tren