How to find the end of a wave before it happens - Nasdaq [Video]
![How to find the end of a wave before it happens - Nasdaq [Video]](https://editorial.fxsstatic.com/images/i/General-Stocks_2.png)
Is it possible to find the end of a move before it happens? The question sounds ambitious, but the answer is yes — as long as you combine the right tools in the right order. Elliott Wave gives you the logic of the market cycles, but on its own it doesn't tell you the exact point of the turn. In this breakdown I show you the layered process we used this week in our live Trading Room, on the Nasdaq, to find the end of the bullish wave.
The market maker's logic, made simple
Before the technical layers, you need to understand what we're looking for. The Market Maker is the one who provides the market's liquidity, and his logic is simple: he buys before a bullish move begins, books profits along the way, exits his position, and now goes short for the next leg. Books profits, and buys again. And so on.
On every swing, the Market Maker earns the spread — long before it rises, out during the rise, short before it falls. The goal of our analysis is to detect, on each of those swings, whether the Market Maker is actually ready to travel in the opposite direction. That's where the system's layers come in.
Layer 1: the Elliott Wave structure
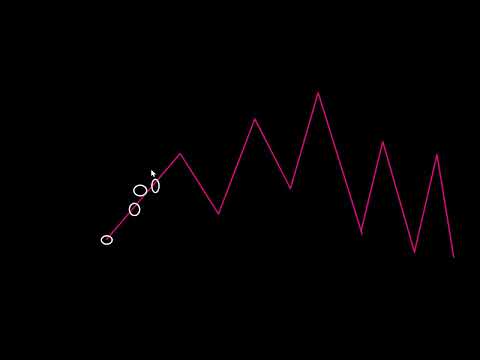
It all starts with the count. On the Nasdaq we had a clear five-wave structure — 1, 2, 3, 4, and 5 — corresponding to a complete bullish move, what we were seeing as Wave 1 of a larger cycle. A completed five-wave sequence means the market is ready for the retracement.
But knowing a retracement "should" come isn't enough. The structure tells us what to expect; the following layers tell us when.
Layer 2: the self line and the +2 area
The first element of the VolWaves system is the Self line: the same price, but converted to a special scale that lets us compare it with the system's other elements. On the chart it's the black line.
The most important deduction from this layer is a clear rule: once price (the Self) extends beyond the +2 area, we need to be ready for the bearish move. Just with the Self line reaching those extremes, we already know a trend change is coming. But there are more layers that confirm it — including a MACD divergence at the top.
Layer 3: the market maker's liquidity
On top of the Self line we add the Market Maker's liquidity. And here the key signal appears: that liquidity isn't traveling with price. While price makes new highs, the Market Maker's liquidity starts turning bearish in that zone — there's a divergence between them.
That divergence is the signature that the Market Maker isn't accompanying the rise. He's doing the opposite: preparing for the bearish move while price is still climbing.
Layer 4: the institutional volume
The third line, the institutional volume, confirms the whole idea. Notice how up to a certain point the institutional volume had been rising, and then it suddenly collapses. That collapse marks the exact moment the Market Maker began selling aggressively — selling everything he could.
With the three layers aligned — price in the +2 area, divergent liquidity, and institutional volume collapsing — there's no more ambiguity: the next move of the cycle is bearish. The strategy focuses on selling, either at the extreme of the move or on a retracement.
Layer 5: The VWAP as target
We have the structure, the count, the liquidity, and the volume. One piece is missing: how far can price go? What's the target?
That's where the VWAP (Volume Weighted Average Price) comes in, a volume-weighted moving average that marks fair value. Taking the full cycle from the reference low, the VWAP gives us a target zone — the place price needs to reach to seek liquidity. Price begins to fall, and approaches that target.
Here an important nuance of the system appears: when price on the scale reaches the negative 2 area, the Market Maker's cycle is about to shift again. He'll start exiting his shorts, possibly accumulating longs. It's the moment to be cautious with sells and prepare for the next turn.
The system's entry rules
The system has clear rules based on the Self's position on the scale. When the Self is below negative 1, we prepare for buys. When the Self is above the +1 area and the cycle has already stretched, we look for sells. And so on, following the Self's bounce between the +2 and -2 zones.
The VWAP, for its part, is the zone price needs to reach to seek liquidity, and the model shows step by step the entry moments — at the entry zones or at the changes in price behavior. In this example, two entries at the highs gave a clean setup.
The core idea
Finding the end of a wave isn't guessing or having a hunch. It's stacking layers of objective confirmation: the Elliott structure says what to expect, the Self line marks the extreme, the Market Maker's liquidity reveals the divergence, the institutional volume confirms the selling, and the VWAP defines the target. When the layers align, the end of the cycle stops being a surprise and becomes a scenario you can read in advance.
This is exactly the kind of analysis we do every day in our Trading Room, across multiple markets and timeframes.
Author

Juan Maldonado
Elliott Wave Street
Juan Maldonado has a University degree in Finance, and Foreign trade started his trading career in 2008. Since 2010 has been analyzing the markets using Elliott Wave with different strategies to spot high probability trades.
















