How the Big Guy indicator predicted the SPX500 drop — A step-by-step breakdown [Video]
![How the Big Guy indicator predicted the SPX500 drop — A step-by-step breakdown [Video]](https://editorial.fxsstatic.com/images/i/Equity-Index_S&P500-1.jpg)
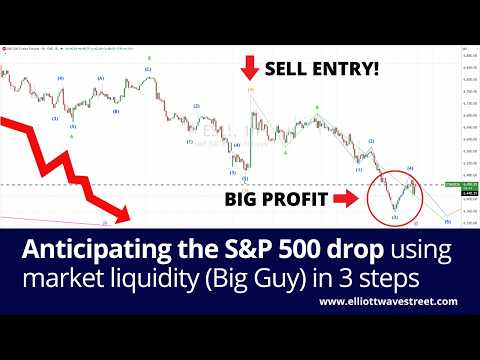
Going from analysis to execution with a clear plan is one of the hardest things in trading. In this article, we'll walk through exactly how we identified the end of Wave 4 in S&P 500 futures and executed a short that captured a significant move to the downside — from roughly 5,659 down to 5,370.
This wasn't a lucky guess or a gut feeling. It was the result of a structured, three-step process: reading fundamentals, confirming institutional liquidity, and timing the entry with Elliott Wave analysis. This is the same approach we apply consistently, and the goal here is to give you the logic behind the trade so you can apply it yourself.
Step 1: Fundamentals set the direction
The first step before looking for any trade is to check the fundamentals. This setup played out on Monday, March 23rd and Tuesday, March 24th, and at that point our fundamentals dashboard was flashing a clear, unambiguous signal in favor of shorts.
The cost of capital was rising. A climbing cost of capital slows the economy and puts downward pressure on risk assets like the S&P 500. As financing gets more expensive, valuations compress and risk appetite fades.
The smart inflation reading was falling. This indicator tells you whether inflation is toxic or not — because inflation isn't always harmful. In this case, the reading pointed to toxicity: the kind of inflation that erodes margins and confidence without generating growth.
Commercials were not buying. Commercial activity was flat, with no signs of risk accumulation from the strong hands. Without that institutional backing, any bounce lacked a solid foundation.
These three elements led to one straightforward conclusion: the only play worth focusing on was the short side of the S&P 500. In a matter of seconds, with the right fundamental read, the ambiguity was gone and the side of the trade was defined.
Step 2: The Big Guy's liquidity confirms the direction
With fundamentals pointing to shorts, the second step was verifying what institutional liquidity was doing — what we call the "Big Guy," the Market Maker providing the market's liquidity.
While most participants were buying, driven by news headlines and the fear of missing out, the Big Guy was selling. This divergence is a powerful signal: when the liquidity provider is facilitating the fundamental direction and retail is trading against it, you're watching the setup for a trap that precedes the real move.
Our proprietary real-time liquidity indicator for TradingView showed the Big Guy's liquidity line consistently pointing lower. With this second element confirmed, the edge compounded: fundamentals and institutional liquidity aligned in the same direction.
Step 3: Elliott Waves and technical analysis for the entry
With fundamentals and liquidity defining the bearish bias, the third step was analyzing price to find the optimal entry point.
From an Elliott Wave perspective, the count showed an ABC structure inside an ending diagonal. This can raise questions — how can an ABC exist inside an impulse? — but Elliott Wave theory allows this type of structure in ending diagonals, where internal waves take corrective forms rather than impulsive ones.
The operational key was identifying the pullback after the initial move. Trading during the high-volatility phase of the first impulse is extremely difficult and not advisable. The practical takeaway is clear: avoid trading during peak volatility. Instead, by waiting for the retracement, two or three entry opportunities emerged with a much better risk-to-reward profile.
At that point, any complementary technical tool was useful: Fibonacci levels, support and resistance zones, or price patterns. The difference is that, with fundamentals and liquidity already understood, all your technical knowledge gets pointed in one direction, eliminating the confusion of trying to guess whether to buy or sell.
The result: The edge of a structured process
The trade captured a move from roughly 5,659 down to 5,370 — a significant drop in S&P 500 futures. This kind of result isn't exceptional or unrepeatable; it's the natural outcome of following a disciplined process that combines three elements in sequence:
First, fundamentals define the direction. Second, institutional liquidity confirms that direction. Third, technical analysis identifies the entry. When all three line up, the probability of success increases substantially and you're trading with a clear edge over those who simply react to headlines.
The lesson: Eliminate ambiguity before you trade
The biggest takeaway from this trade is that ambiguity is the trader's enemy. When you don't know whether you should be buying or selling, every price move triggers anxiety and impulsive decisions. When the bias is clear — backed by fundamentals and liquidity — your technical analysis becomes a precision tool instead of a guessing exercise.
This process can be followed every single day. Cycles repeat, fundamentals shift, and opportunities appear. What doesn't change is the discipline of following the steps in order and respecting the plan.
Author

Juan Maldonado
Elliott Wave Street
Juan Maldonado has a University degree in Finance, and Foreign trade started his trading career in 2008. Since 2010 has been analyzing the markets using Elliott Wave with different strategies to spot high probability trades.
















