Here's the pattern that will trigger a stock market crash [Video]
![Here's the pattern that will trigger a stock market crash [Video]](https://editorial.fxsstatic.com/images/i/Equity-Index_S&P500-2.jpg)
Emini S&P June futures I thought we had peaked on Wednesday and we did, but I thought we are about to establish a short term sideways trading range.
But there was definitely no sell signal so I could not recommend gambling on a downturn at this stage.
Well I do not regret this analysis. Even with hindsight, given the same situation again, I could not recommend a short position without a sell signal.
Having said that, in my video I did identify a small head and shoulders pattern, which if completed would have triggered a drop of around 100 points.

But even then I did not expect that move to occur within hours. I expected a relatively controlled decline over a couple of days.
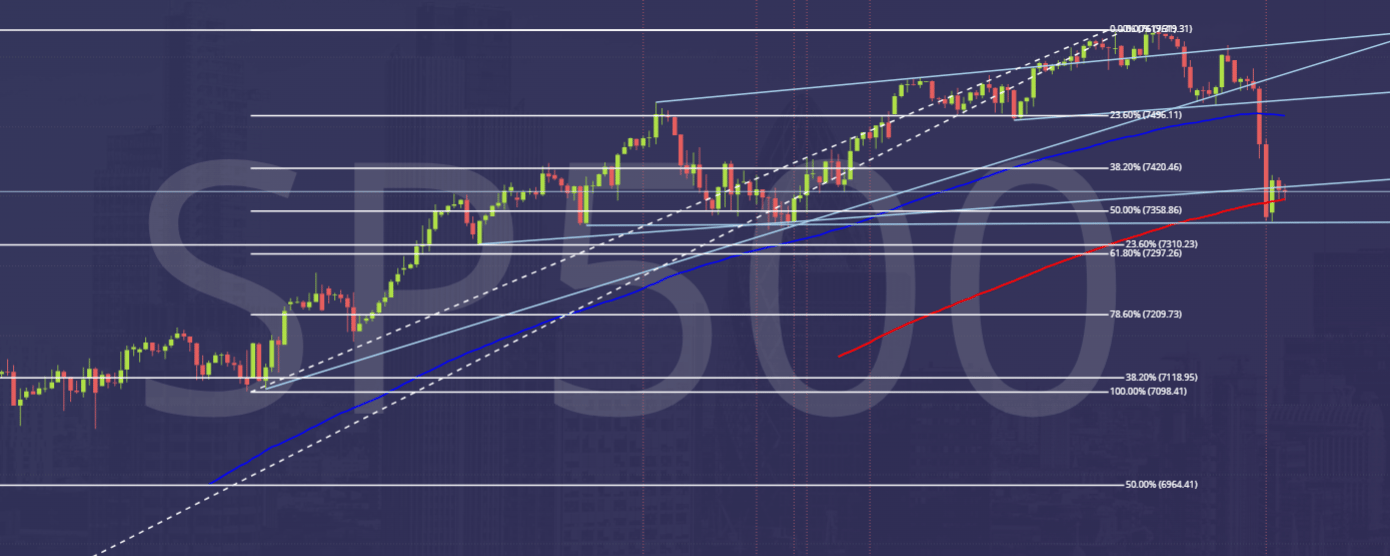
Once we broke support at 7540/35 & Fibonacci support at 7517/12 we crashed to the next target of 7445/7440, which was the measured target for Head and Shoulders pattern.
But we collapsed as far as 7359, wiping out 2 days of gains in the latter half of the week.
Further losses look likely considering we closed close to the low of the day & the week.
But those losses may only extend as far as support at the 7350/7330 area.
I understand the reason for the losses was fear of higher interest rates after the strong employment numbers.
In my experience this kind of trigger does not last too long, especially in such a strong longer term bull trend.
The only counter argument to that is that we have a large bearish engulfing candle on the weekly chart
And that's something I must pay attention to.
Longs need stops below 7300.
I would take a break below here as another sell signal initially targeting 7280/75 then 7255/50 & even 7225/20 is possible.
But I do think we could have very strong support around 7200/7185 if we fall this far.
If we do manage to bounce from the 7350/7330 area, we should target 7400 & even minor resistance at 7423/28.
Maybe a high for the morning session is possible here, but I still think shorts could be risky.
On a break above 7435 look for 7445 & 7460/65.
After Friday's shock however gains are likely to be limited, & I did suggest a consolidation phase was overdue.
I think there is a good chance that we start to range from 7350/7330 up to 7520/7530.
But maybe resistance at 7460/65 will cap any rally today.
Author

Jason Sen
DayTradeIdeas.co.uk
Jason Sen began his career in the options pits on the trading floor of LIFFE in 1987 at the age of 19, making markets on his own account. In 2001 when the trading floor closed he successfully made the transition to day trading on computer screens.