HDFC Bank bounce from the blue box – Will the rally continue?

HDFC Bank Limited is an Indian banking and financial services company headquartered in Mumbai. It is India’s largest private sector bank by assets and world’s 10th largest bank by market capitalization as of April 2021, the third largest company by market capitalization of $122.50 billion on the Indian stock exchanges. It is also the fifteenth largest employer in India with nearly 120,000 employees.
HDFC Bank daily chart May 28th 2022
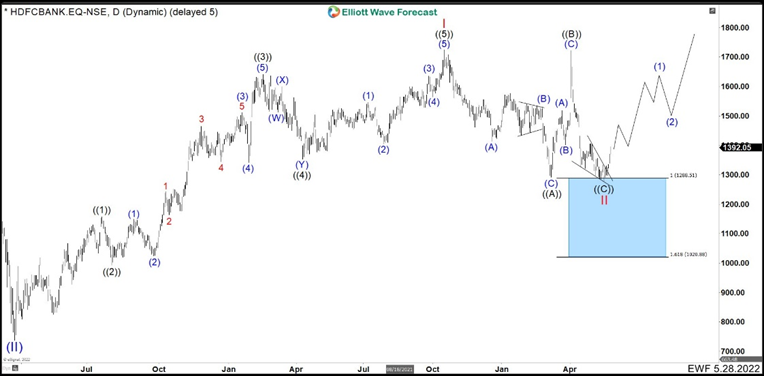
Last May, we showed how HDFC BANK completed an impulse at 1726.02 from March 2020 low and we called it wave I. From there we had a corrective movement. The drop from the peak 1726.02 was in 3 swings. Wave (A) ended at 1412.85, corrective wave (B) made a triangle and ended at 1530.84. It then continued lower to complete wave (C) and wave ((A)) at 1291.96. The market had a strong rebound that tested the highs ending wave ((B)) at 1721.65 and turned quickly making an ending diagonal structure completing wave ((C)) and wave II at 1280.31. (If you want to learn more about Elliott Wave Theory, follow these links: Elliott Wave Education and Elliott Wave Theory).
HDFC Bank daily chart August 09th 2022
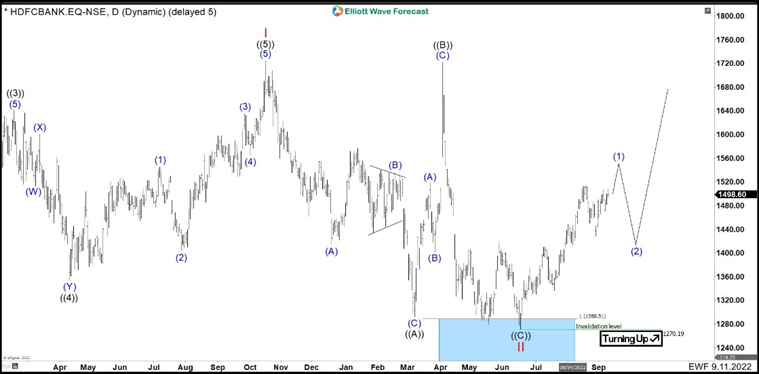
After the bounce from the blue box, we were surprised by low testing again. Therefore, wave ((C)) and wave II ended the cycle at 1270.19 to continue the rally. We can see from the chart that since the new low, HDFC Bank has already built 4 waves up and needs one more wave to break 1513.88 to finish an impulse. We will call this impulse wave (1). After this, we expect a corrective move in 3, 7 or 11 swings to end wave (2) and then continue with the rally. The view is valid as long as the correction remains above 1270.19.
HDFC Bank daily chart August 09th 2022 alternative view
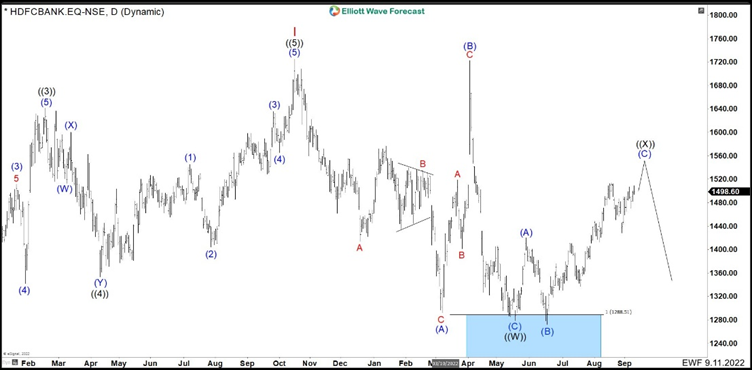
An alternative count for HDFC Bank is that it makes a double correction from 1726.02 peak. That is, the low of 1721.65 is considered as wave ((W)) and we are currently finishing a flat correction (A), (B), and (C), as wave ((X)). In this situation, what would happen is that when the impulse is completed, the stock price will continue to fall below 1270.19. Therefore, the movement of the market in this last quarter will be very important to determine what will happen with the share’s prices for the beginning of the next year.
Author

Elliott Wave Forecast Team
ElliottWave-Forecast.com


