Has the rally lost steam? Price, momentum, and volume hold the clues [Video]
![Has the rally lost steam? Price, momentum, and volume hold the clues [Video]](https://editorial.fxstreet.com/images/TechnicalAnalysis/Momentum/charts-showing-a-dynamic-evolution-gm476027230-64520413.jpg)
Watch the video extracted from the WLGC session before the market open on 2 Jan 2024 below to find out the following:
-
The key support zone S&P 500 needs to hold.
-
How the market correction could unfold.
-
The first red flag and the condition you need to know.
-
The most important thing you should do to deal with the current market.
-
And a lot more.
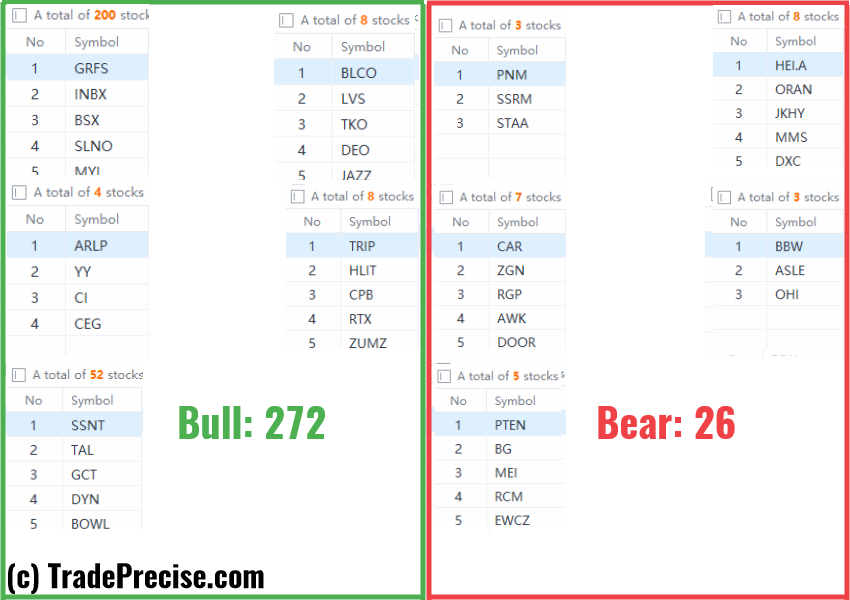
The bullish vs. bearish setup is 272 to 26 from the screenshot of my stock screener below pointing to a healthy and positive market environment (despite a sharp decrease from 600++ bullish setups).
Despite the negative price action in the S&P 500, the support zone as discussed in the tweet below is still holding up, which is constructive for the bullish case.
"As long as the range is holding up, the rally will still going on. There's increasing of the supply level, but it's a localized increase means that there are some people taking profits." $ES $SPX #SP500 pic.twitter.com/5Y1hiQVwHc
— Ming Jong Tey (@MingJong) December 28, 2023
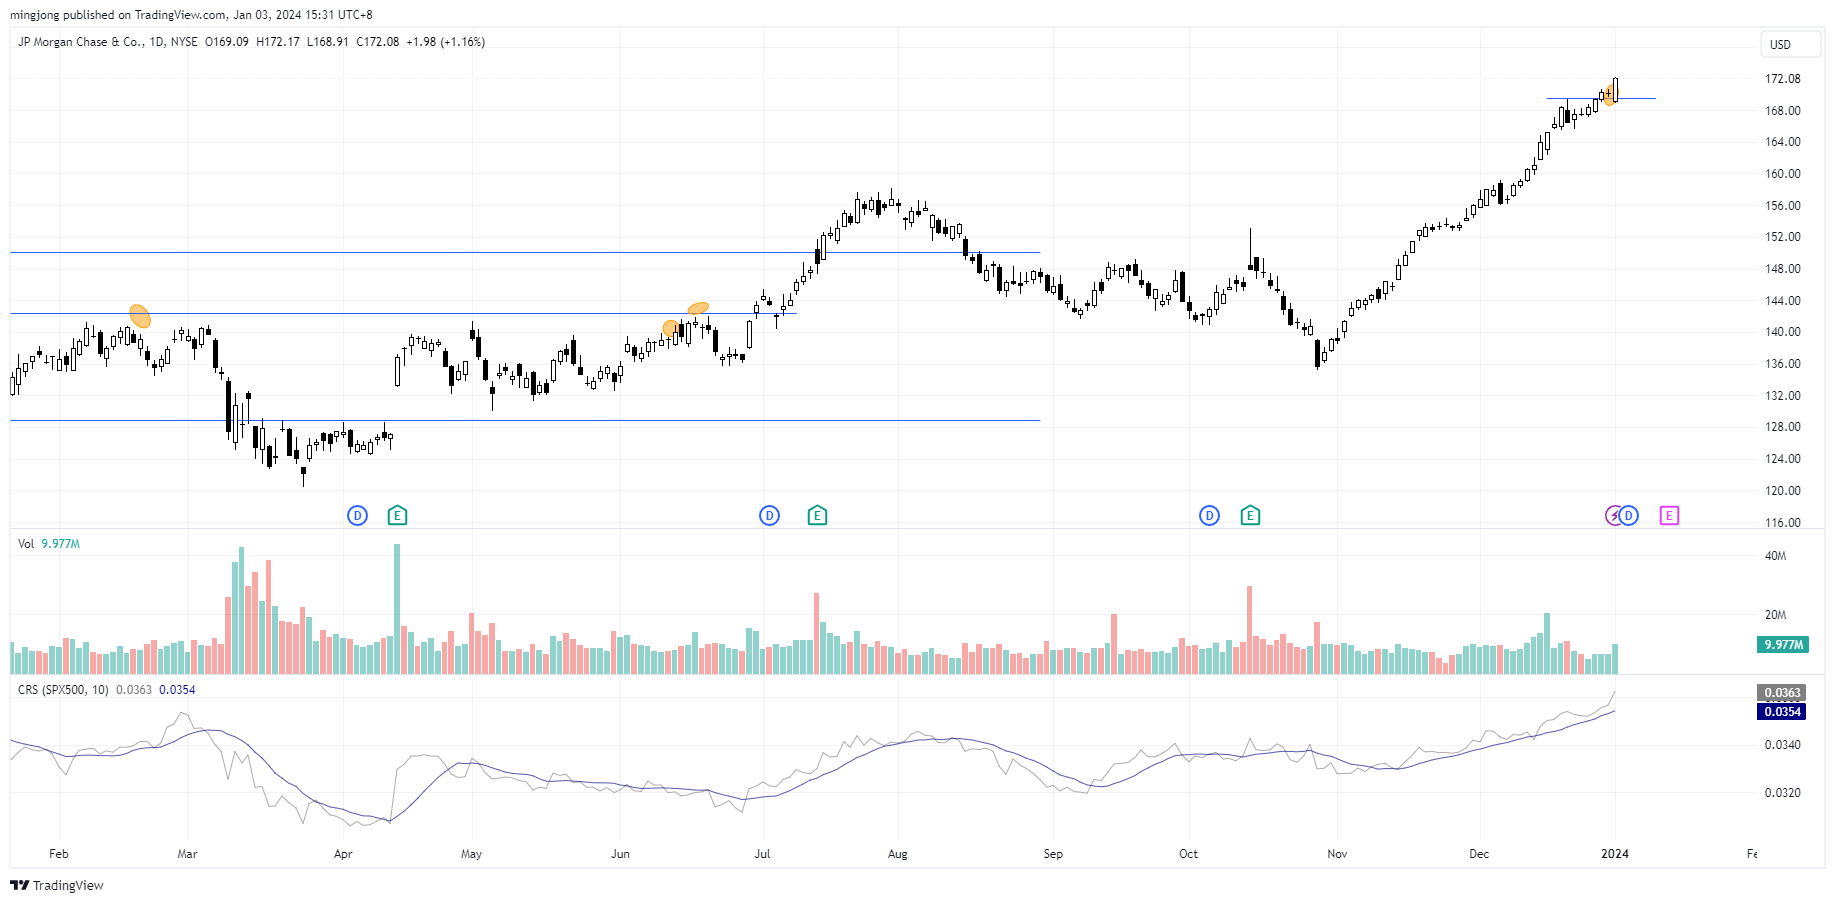
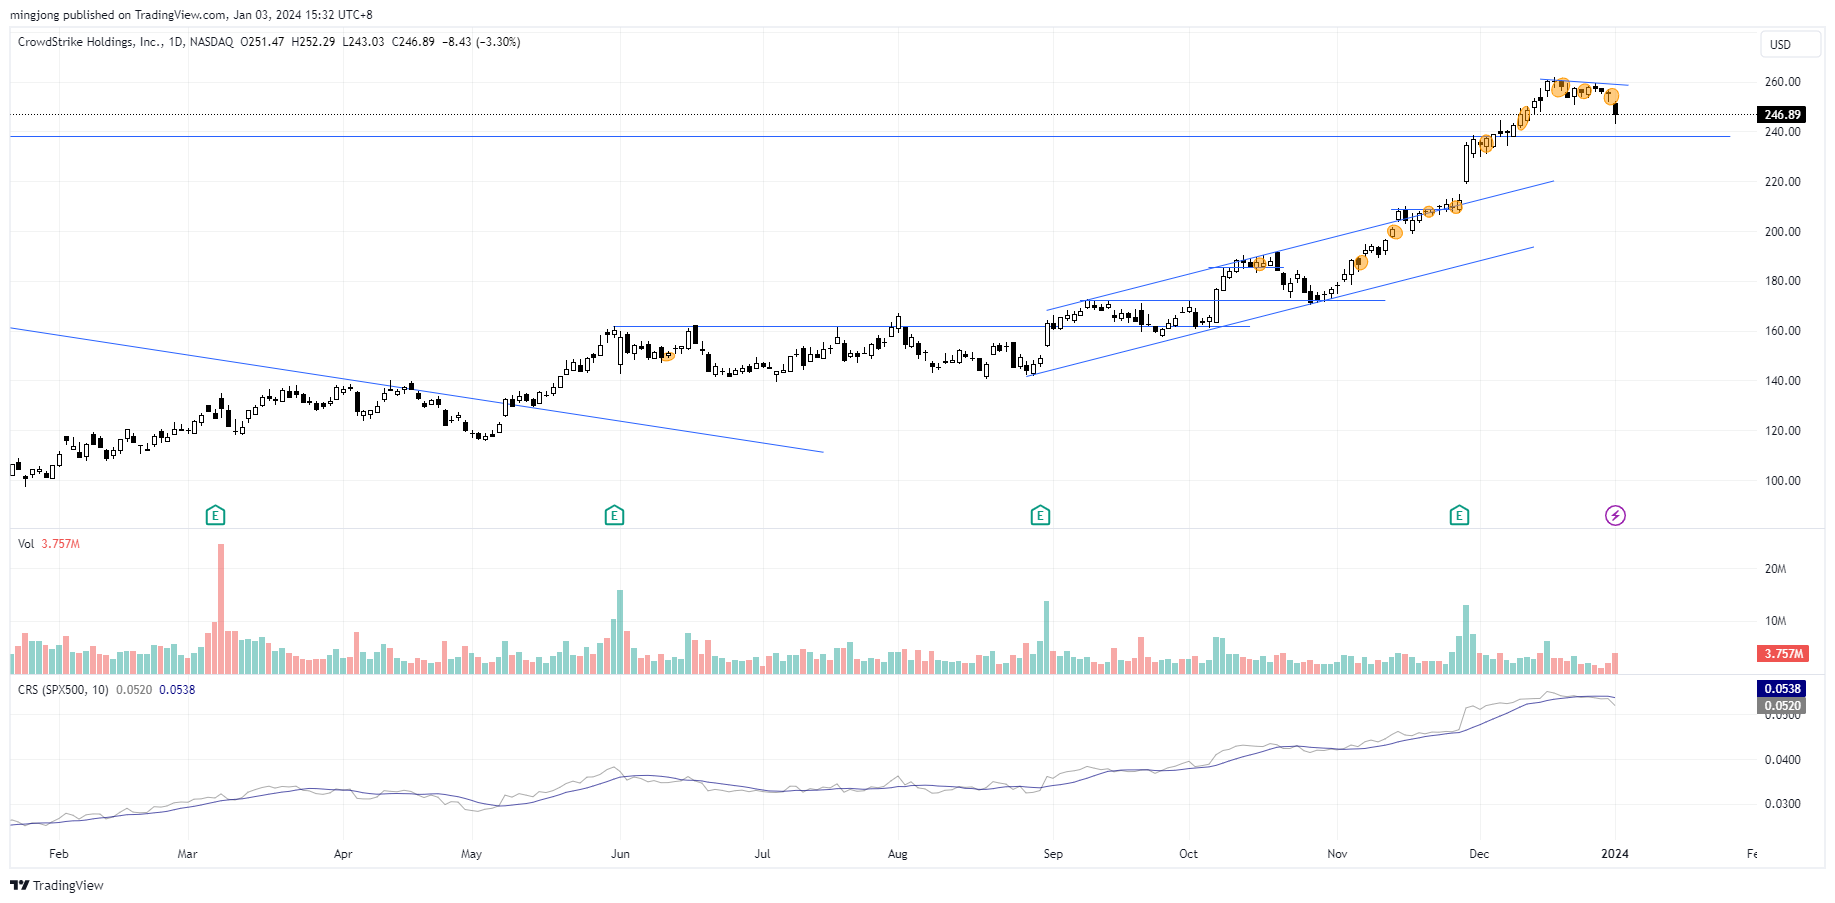
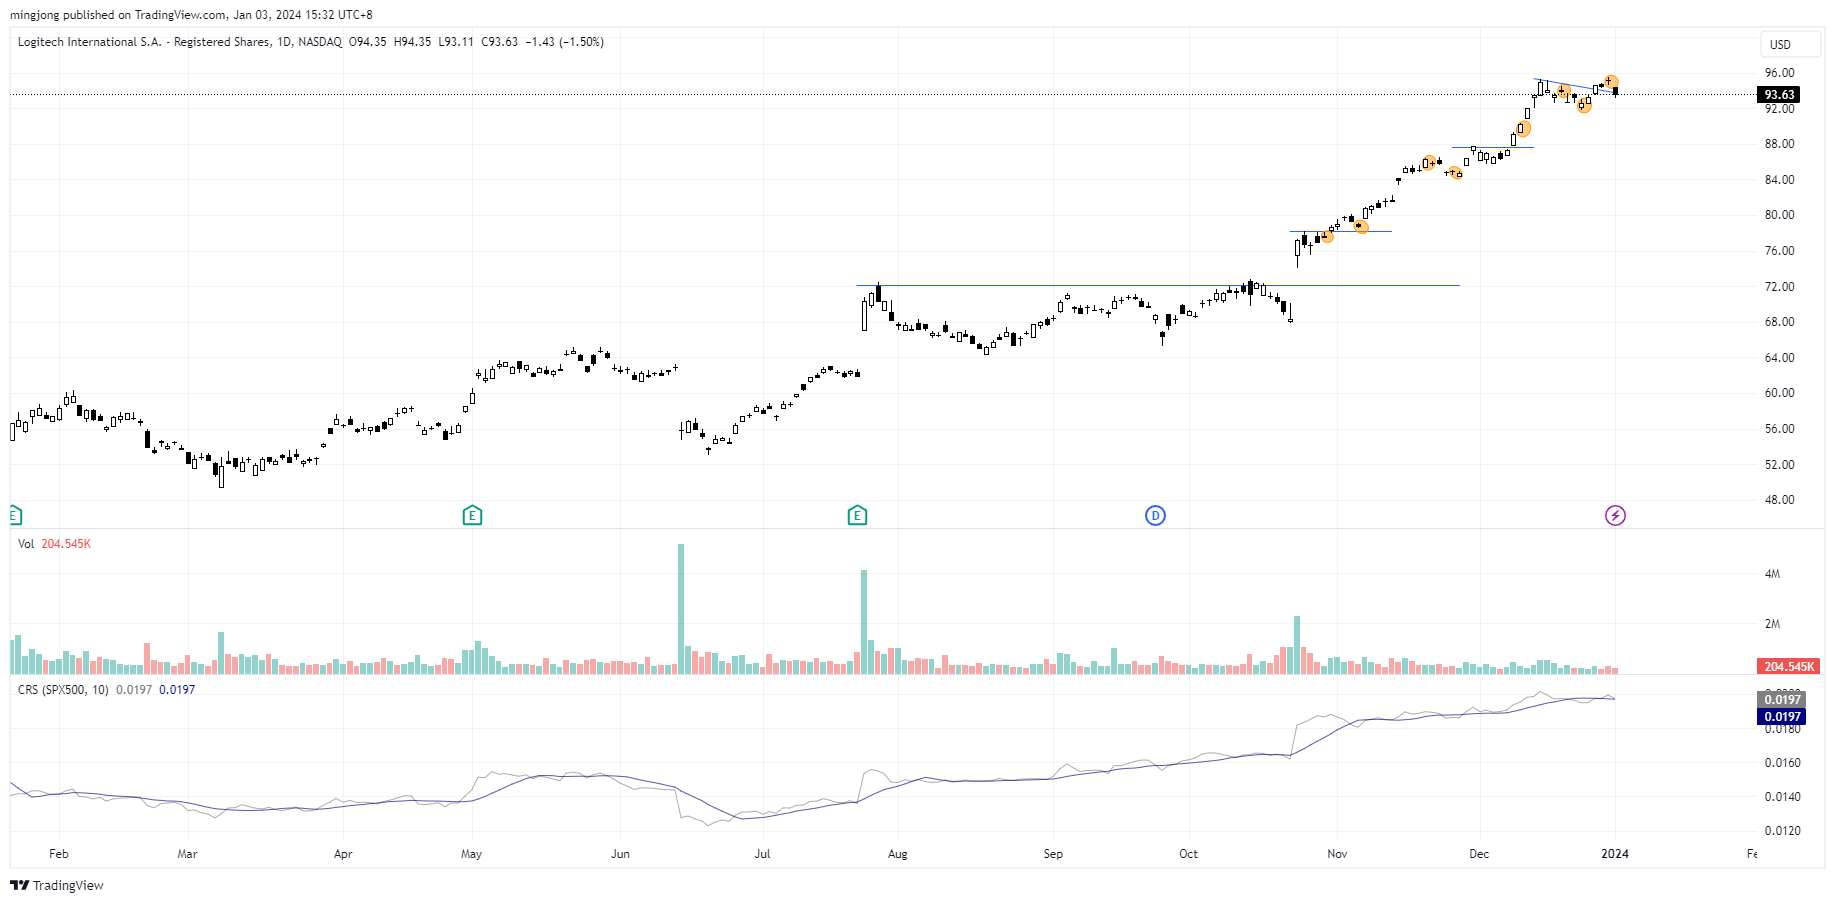
6 “low-hanging fruits” (JPM, CRWD, etc…) trade entries setup + 28 others (LOGI etc…) plus 14 “wait and hold” candidates have been discussed during the live session before the market open (BMO).
JPM
CRWD
LOGI
Author

Ming Jong Tey
Independent Analyst
Ming Jong Tey has been trading since 2008. He started his learning journey from technical analysis (indicators, Fibonacci, etc...) to value investing. Throughout his journey, he develops an interest in price action with chart pattern trading.