Gold struggles as strong US Dollar and rising yields cap gains
- Gold trades on the back foot amid a firmer US Dollar.
- US-Iran war supports safe-haven demand, but Oil-driven inflation fears cap gains in the yellow metal.
- Technically, XAU/USD continues to consolidate within the $5,000-$5,250 range.

Gold (XAU/USD) trades under pressure on Thursday as a stronger US Dollar (USD) and rising Treasury yields cap upside attempts. At the time of writing, XAU/USD trades around $5,113, down nearly 1.20% on the day.
However, the precious metal remains trapped within a familiar range and lacks strong directional momentum as traders weigh opposing macroeconomic forces. The ongoing US-Iran war continues to underpin safe-haven demand and help limit deeper losses.
At the same time, concerns that the conflict could trigger an Oil-driven inflation shock are reinforcing a hawkish Federal Reserve (Fed) narrative that keeps the USD and Treasury yields broadly elevated, limiting Gold’s upside.
Fed rate-cut bets fade as US-Iran war intensifies
The US-Iran war entered its thirteenth day on Thursday, with attacks intensifying across the Middle East and no clear signs of de-escalation.
Iranian President Masoud Pezeshkian signaled that Tehran would only consider ending the conflict under certain conditions, including recognition of Iran’s “legitimate rights,” payment of war reparations, and guarantees against future aggression.
The conflict is disrupting global Oil flows through the Strait of Hormuz, with Iran targeting Oil tankers and commercial vessels near the key shipping route, raising concerns about prolonged supply disruptions.
Iran’s new Supreme Leader, Mojtaba Khamenei, said on Thursday that the closure of the Strait of Hormuz should continue as a tool to pressure Iran’s enemies.
Oil prices have surged sharply since the conflict began and remain volatile despite efforts to calm the market. The International Energy Agency (IEA) agreed to release 400 million barrels from emergency reserves, including 172 million barrels from the US Strategic Petroleum Reserve.
According to a BHH report, nearly 15 million barrels per day (mb/d) of crude Oil pass through the Strait of Hormuz, or about 10 mb/d assuming alternative routes operate at full capacity. Based on these estimates, the IEA’s Oil stock release could cover roughly 27 to 40 days of supply disruption.
Against this backdrop, markets no longer fully price in even one 25 basis point (bps) cut in 2026, marking a sharp repricing from earlier expectations before the conflict began, providing an additional tailwind for the US Dollar.
Recent US inflation data also supports a cautious Fed stance, with focus now on the Personal Consumption Expenditures (PCE) Price Index report due on Friday.
Technical analysis: XAU/USD trades sideways between $5,000 and $5,250
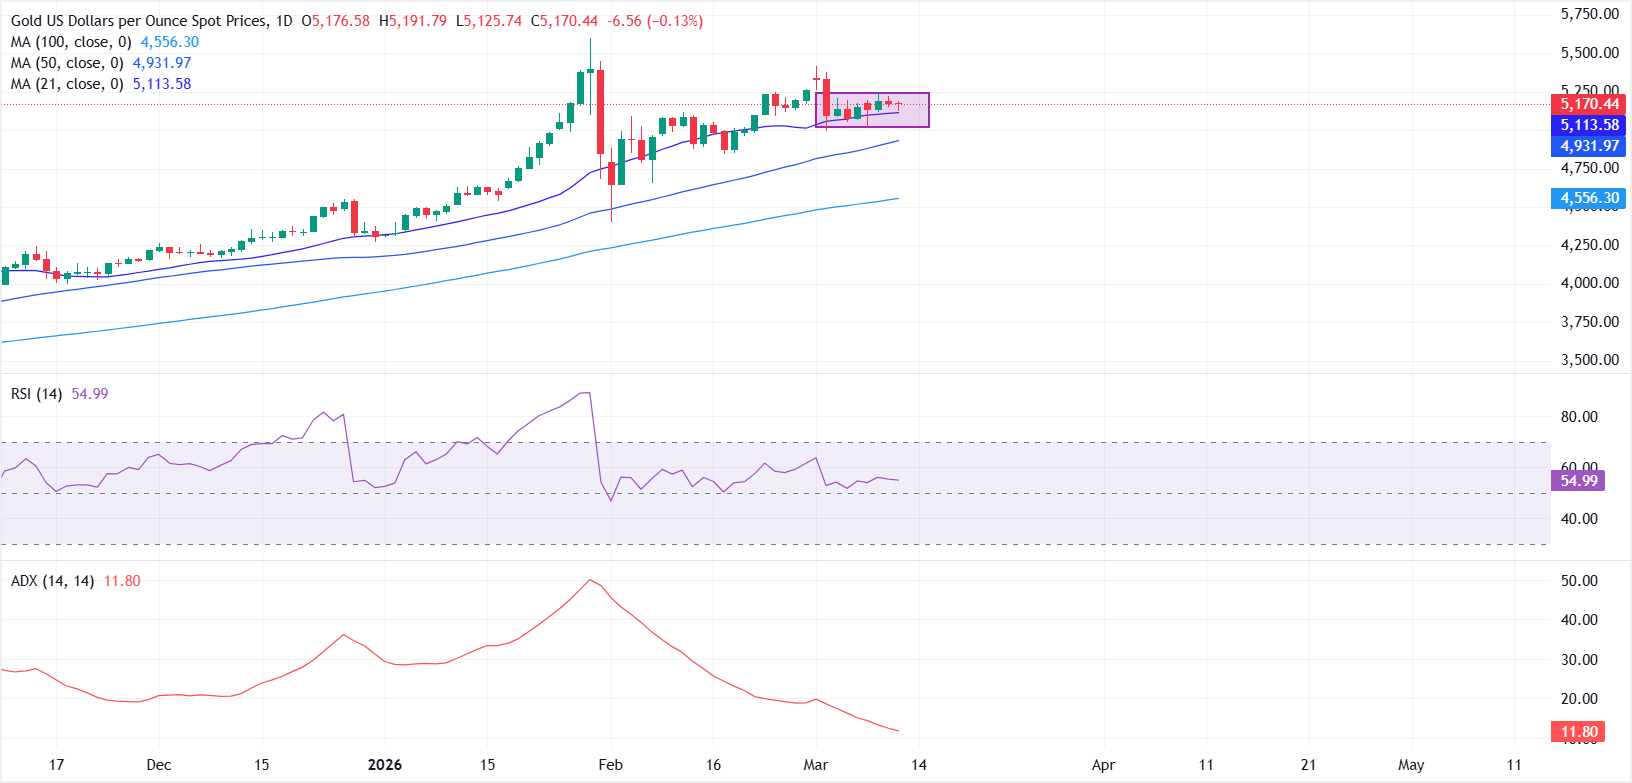
From a technical perspective, the daily chart shows XAU/USD consolidating between $5,000 and $5,250, reflecting a pause in the broader uptrend. The near-term bias remains mildly bullish as the price continues to hold above the rising 21-day and 50-day Simple Moving Averages (SMAs), which in turn remain well above the 100-day SMA, reinforcing the underlying bullish structure.
The Relative Strength Index (RSI) is hovering near 55, holding above its midline and suggesting that bullish momentum remains intact. Meanwhile, the Average Directional Index (ADX) has slipped toward 12, pointing to waning trend strength.
On the upside, $5,200 remains the immediate resistance level, followed by Tuesday’s peak near $5,238. A decisive break above this zone could revive bullish momentum and open the door for a move toward $5,419, the March 2 high.
On the downside, initial support emerges near the 21-day SMA around $5,115, followed by the 50-day SMA near $4,932. A sustained break below this area could trigger fresh selling pressure, exposing the 100-day SMA near $4,556 as the next key support level.
Gold FAQs
Gold has played a key role in human’s history as it has been widely used as a store of value and medium of exchange. Currently, apart from its shine and usage for jewelry, the precious metal is widely seen as a safe-haven asset, meaning that it is considered a good investment during turbulent times. Gold is also widely seen as a hedge against inflation and against depreciating currencies as it doesn’t rely on any specific issuer or government.
Central banks are the biggest Gold holders. In their aim to support their currencies in turbulent times, central banks tend to diversify their reserves and buy Gold to improve the perceived strength of the economy and the currency. High Gold reserves can be a source of trust for a country’s solvency. Central banks added 1,136 tonnes of Gold worth around $70 billion to their reserves in 2022, according to data from the World Gold Council. This is the highest yearly purchase since records began. Central banks from emerging economies such as China, India and Turkey are quickly increasing their Gold reserves.
Gold has an inverse correlation with the US Dollar and US Treasuries, which are both major reserve and safe-haven assets. When the Dollar depreciates, Gold tends to rise, enabling investors and central banks to diversify their assets in turbulent times. Gold is also inversely correlated with risk assets. A rally in the stock market tends to weaken Gold price, while sell-offs in riskier markets tend to favor the precious metal.
The price can move due to a wide range of factors. Geopolitical instability or fears of a deep recession can quickly make Gold price escalate due to its safe-haven status. As a yield-less asset, Gold tends to rise with lower interest rates, while higher cost of money usually weighs down on the yellow metal. Still, most moves depend on how the US Dollar (USD) behaves as the asset is priced in dollars (XAU/USD). A strong Dollar tends to keep the price of Gold controlled, whereas a weaker Dollar is likely to push Gold prices up.
Author

Vishal Chaturvedi
FXStreet
I am a macro-focused research analyst with over four years of experience covering forex and commodities market. I enjoy breaking down complex economic trends and turning them into clear, actionable insights that help traders stay ahead of the curve.













