|

Gold Price News and Forecast: XAU/USD witnessed some short-covering on Tuesday and staged a goodish bounce from nine-month lows

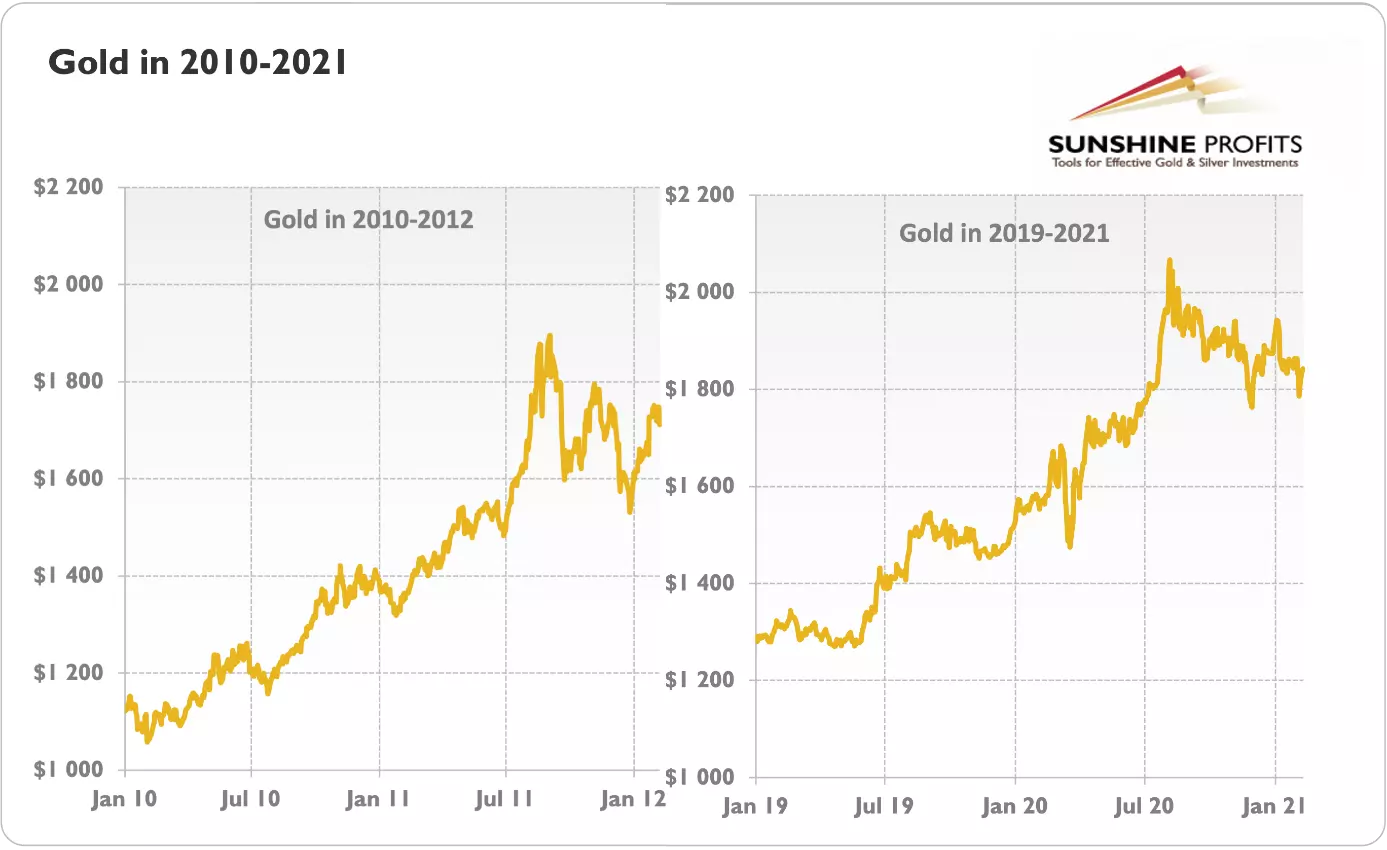
Is gold now replaying 2010-2012?

The 2019-2021 gold chart is disturbingly similar to that of 2010-2012, but it does not have to be the harbinger of a bear market.

Many ancient cultures saw history as cyclical. According to this view, society passes through repeated cycles. Can this apply to gold as well? I’m not referring here to the simple fact that we have both bull and bear markets in the precious metals –" I refer here to the observation that gold’s price pattern seen in 2019-2021 mirrors that of 2010-2012. Please take a look at the chart below.
Read more...

Gold Price Analysis: XAU/USD jumps to three-day tops, around $1720 level

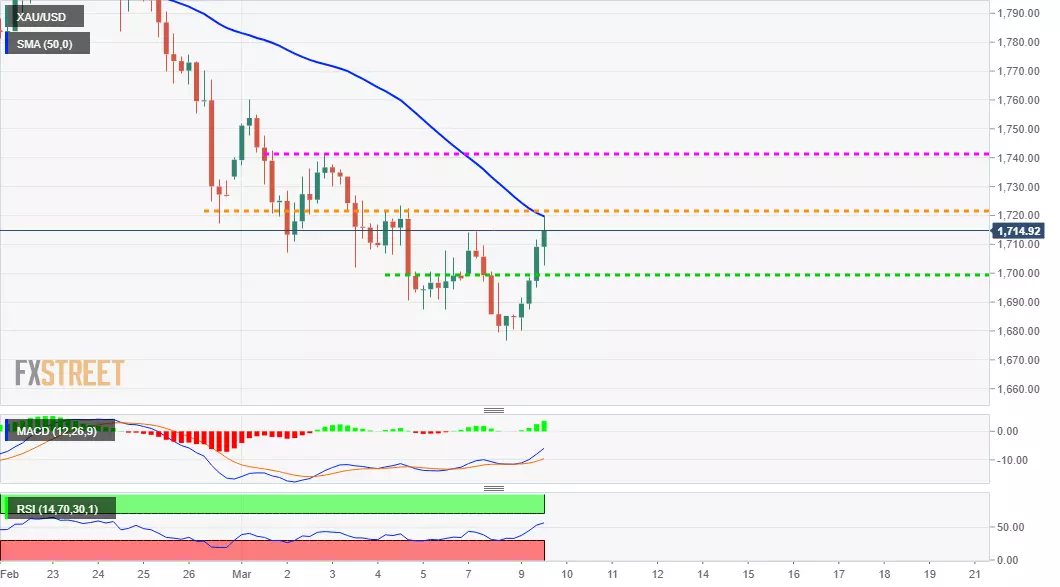
Gold built on its goodish intraday positive move and climbed to three-day tops, around the $1720 region during the early North American session.

A sharp pullback in the US Treasury bond yields turned out to be a key factor extending support to the non-yielding yellow metal. Retreating US bond yields prompted some US dollar profit-taking, which, in turn, provided an additional boost to the dollar-denominated commodity.

From a technical perspective, oversold RSI on the daily chart remained supportive of the short-covering bounce. Moreover, oscillators on hourly charts have been gaining some positive traction and support prospects for further recovery from nine-month lows touched on Monday.
Read more...

Author

FXStreet Team

Composed of a group of economic journalists and FX experts, the FXStreet content team produces and oversees all content published on FXStreet. It provides a purely journalistic approach to the Forex market.


More from FXStreet Team
Share:

Editor's Picks

GBP/USD: Daily gains remain capped by 1.3650

GBP/USD leaves behind Monday’s pessimism and advances marginally on Tuesday. Cable’s humble gains, however, appear to have met quite a decent resistance in the 1.3650 zone for now, in a context of a slight selling pressure hovering around the Greenback.

EUR/USD struggles to regain pace; gyrates around 1.1670

EUR/USD clinches humble gains around 1.1670 following Tuesday’s close on Wall Street. Indeed, marginal losses in the US Dollar encourages spot to set aside two dauly pullbacks in a row and maintain the 1.1700 barrier on the cross-hairs for now. Moving forward, US inflation tracked by the PCE and another revision of Q2 GDP data should keep investors entertained on Wednesday.

Gold: Buyers still hold the grip

Gold navigates the middle of its daily range near $4,650 per troy ounce on Tuesday. The lack of clear direction in the yellow metal comes on the back of the widespread cautious tone among market participants, a mildly offered stance in the US Dollar and a marked decline in US Treasury yields across the curve.

Australia CPI expected to show inflation easing in July
The Australian Bureau of Statistics (ABS) will publish the July Consumer Price Index (CPI) on Wednesday at 01:30 GMT. The report is expected to show that inflation rose 3.2% from a year earlier, easing from the 3.8% posted in June. The monthly CPI, however, is forecast at 0.8% following the -0.1% print from the previous month.
Canada hits US goods with tariffs; The rate market sees a problem
On September 8, Canada begins charging its own importers 15%, 25% and 50% on roughly 700 lines of American goods. The measure is billed as dollar for dollar, and on the arithmetic of covered trade it is. What it is not is a tax on the United States.
Canada hits US goods with tariffs; The rate market sees a problem
On September 8, Canada begins charging its own importers 15%, 25% and 50% on roughly 700 lines of American goods. The measure is billed as dollar for dollar, and on the arithmetic of covered trade it is. What it is not is a tax on the United States.