Gold Price Forecast: XAU/USD looks to retest $1794 if the rebound sustains – Confluence Detector
- Gold catches a fresh bid but remains confined in a familiar range.
- US dollar remains broadly subdued amid a return of risk appetite.
- Firmer Treasury yields to limit the upside in gold price.
- Gold Weekly Forecast: XAU/USD poised to extend slide after breaking key supports

Gold price is clawing back earlier losses, as the US dollar remains on the defensive amid conflicting signals on inflation and Fed’s next monetary policy moves, especially after the policymakers from the world’s most powerful central bank delivered mixed messages. Further, a return of risk appetite in European trading has dulled the dollar’s safe-haven appeal, underpinning gold’s recovery. Gold price now awaits a raft of relevant US economic data, which will shed fresh light on the economy and likely Fed’s action. Therefore, investors remain in a wait-and-see mode before placing any aggressive bets on gold price. However, Friday’s PCE inflation release will remain the key event risk for gold.
Read: US May PCE inflation preview: Data likely to reaffirm FOMC's hawkish tilt
Gold Price: Key levels to watch
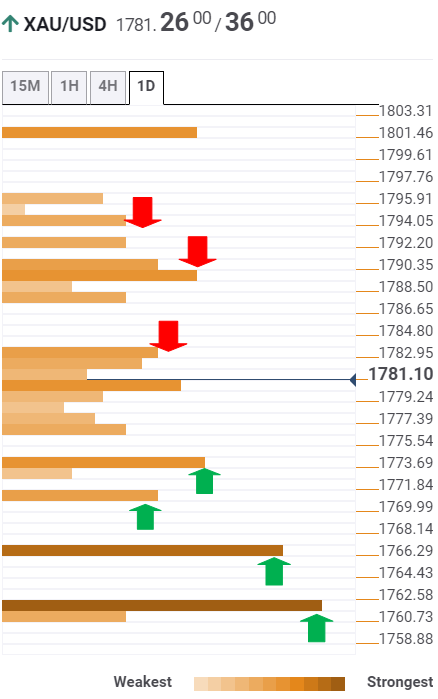
The Technical Confluences Detector shows that gold price has staged a decent bounce from $1773 support once again, which is the convergence of the previous day’s low, previous low four-hour and Bollinger Band four-hour Lower.
Gold bulls now look to recapture strong resistance at $1783, where the Fibonacci 61.8% one-day and Bollinger Band one-hour Upper
The next supply zone awaits at the Fibonacci 38.2% one-day of $1787, above which the confluence of the Fibonacci 23.6% one-week and one-day at $1790 will get tested.
The level to beat for gold buyers is the SMA100 one-day at $1794.
Alternatively, if the $1773 support cracks then the downside will resume towards the initial target of $1771, which is the pivot point one-day R1.
Strong support will emerge at the previous month’s low of $1766, below which the sellers will target the previous week’s low at $1761, where the pivot point one-day S2 meets.
Here is how it looks on the tool
About Technical Confluences Detector
The TCD (Technical Confluences Detector) is a tool to locate and point out those price levels where there is a congestion of indicators, moving averages, Fibonacci levels, Pivot Points, etc. If you are a short-term trader, you will find entry points for counter-trend strategies and hunt a few points at a time. If you are a medium-to-long-term trader, this tool will allow you to know in advance the price levels where a medium-to-long-term trend may stop and rest, where to unwind positions, or where to increase your position size.
Author

Dhwani Mehta
FXStreet
Residing in Mumbai (India), Dhwani is a Senior Analyst and Manager of the Asian session at FXStreet. She has over 10 years of experience in analyzing and covering the global financial markets, with specialization in Forex and commodities markets.
















