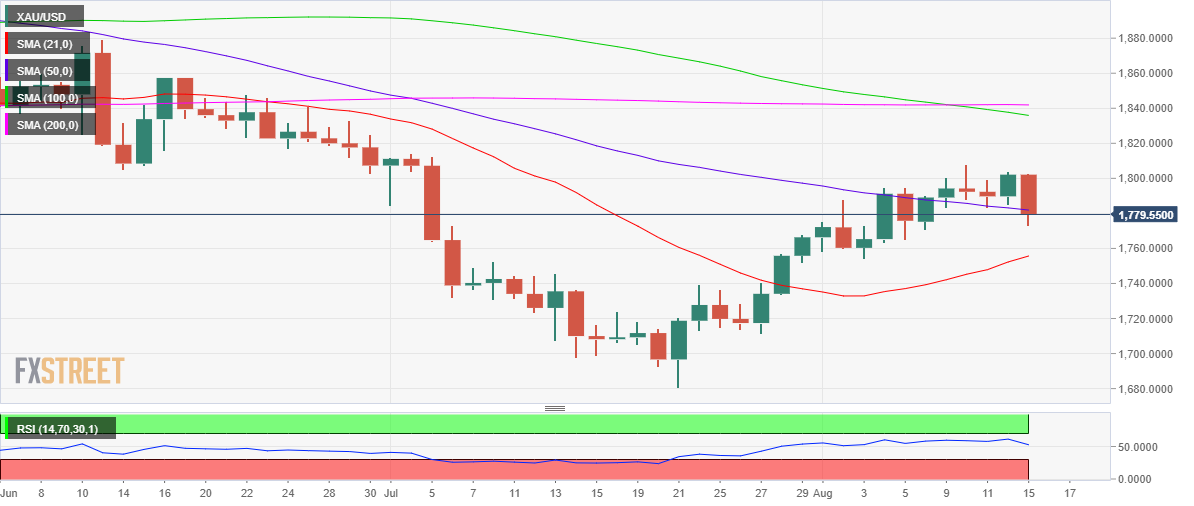
- Gold Price breaches the critical 50 DMA at $1,782 despite falling yields.
- China data-led triggers risk-aversion, boosts the safe-haven US dollar.
- XAU/USD remains exposed to testing the bullish 21 DMA on a daily closing below 50 DMA.
Gold Price is deep in the red in the American session, as investors resort to ‘sell-everything mode amid broad risk-aversion.
The latest leg down in the yellow metal took out the critical 50-Daily Moving Average (DMA) at $1,782, as the selling pressure intensified after the US stocks opened lower.
Risk-off flows extended into American trading, as downbeat Chinese activity data accentuated concerns over the health of the global economy while investors remained wary about the size of the next Fed rate hike move in the coming months.
Also read: Gold Price Forecast: XAU/USD closes the week above 50 DMA, what’s next?
Gold traders failed to capitalize on the unexpected rate cuts by the People’s Bank of China (PBOC), as it unnerved the market even further and offered extra zest to the best safety bet in the US dollar. Over the last hour, the bullion is finding some support near $1,770 levels amid a sharp sell-off in the US Treasury yields, investors scurry to the safe-haven American government bonds.
Technically, gold sellers eye a daily closing below the 50 DMA to resume the downslide towards the bullish 21 DMA at $1,756. Alternatively, if bulls manage to defend the former, then a rebound towards the $1.800 barrier will be inevitable.
The 14-day Relative Strength Index (RSI) has turned south, attacking the midline, justifying the recent weakness in the yellow metal.
Gold Price: Daily chart
Gold Price: Additional levels to consider
Information on these pages contains forward-looking statements that involve risks and uncertainties. Markets and instruments profiled on this page are for informational purposes only and should not in any way come across as a recommendation to buy or sell in these assets. You should do your own thorough research before making any investment decisions. FXStreet does not in any way guarantee that this information is free from mistakes, errors, or material misstatements. It also does not guarantee that this information is of a timely nature. Investing in Open Markets involves a great deal of risk, including the loss of all or a portion of your investment, as well as emotional distress. All risks, losses and costs associated with investing, including total loss of principal, are your responsibility. The views and opinions expressed in this article are those of the authors and do not necessarily reflect the official policy or position of FXStreet nor its advertisers. The author will not be held responsible for information that is found at the end of links posted on this page.
If not otherwise explicitly mentioned in the body of the article, at the time of writing, the author has no position in any stock mentioned in this article and no business relationship with any company mentioned. The author has not received compensation for writing this article, other than from FXStreet.
FXStreet and the author do not provide personalized recommendations. The author makes no representations as to the accuracy, completeness, or suitability of this information. FXStreet and the author will not be liable for any errors, omissions or any losses, injuries or damages arising from this information and its display or use. Errors and omissions excepted.
The author and FXStreet are not registered investment advisors and nothing in this article is intended to be investment advice.
Recommended content
Editors’ Picks
EUR/USD clings to daily gains above 1.0650

EUR/USD gained traction and turned positive on the day above 1.0650. The improvement seen in risk mood following the earlier flight to safety weighs on the US Dollar ahead of the weekend and helps the pair push higher.
GBP/USD recovers toward 1.2450 after UK Retail Sales data

GBP/USD reversed its direction and advanced to the 1.2450 area after touching a fresh multi-month low below 1.2400 in the Asian session. The positive shift seen in risk mood on easing fears over a deepening Iran-Israel conflict supports the pair.
Gold holds steady at around $2,380 following earlier spike

Gold stabilized near $2,380 after spiking above $2,400 with the immediate reaction to reports of Israel striking Iran. Meanwhile, the pullback seen in the US Treasury bond yields helps XAU/USD hold its ground.
Bitcoin Weekly Forecast: BTC post-halving rally could be partially priced in Premium

Bitcoin price shows no signs of directional bias while it holds above $60,000. The fourth BTC halving is partially priced in, according to Deutsche Bank’s research.
Week ahead – US GDP and BoJ decision on top of next week’s agenda

US GDP, core PCE and PMIs the next tests for the Dollar. Investors await BoJ for guidance about next rate hike. EU and UK PMIs, as well as Australian CPIs also on tap.