Gold Price Forecast: XAU/USD bulls likely to target $1,966 resistance – Confluence Detector
- Gold scaled higher through the early European session and shot to a two-week high on Monday.
- The Ukraine crisis, worries about rising inflation continued acting as a tailwind for the commodity.
- The Fed’s hawkish outlook, surging US bond yields might cap gains ahead of the US CPI on Tuesday.

Gold attracted some follow-through buying on Monday and shot to a two-week high during the early part of the European session. Investors remain concerned about the potential economic fallout from the war in Ukraine, which was evident from a generally weaker tone around the equity markets. This, in turn, continued benefitting traditional safe-haven assets and pushed spot prices higher, taking along some short-term trading stops near the $1,950 level. Apart from this, worries that the recent surge in commodity prices will put upward pressure on the already high consumer prices further bolstered the commodity's appeal as a hedge against rising costs. That said, expectations that the Fed would tighten its monetary policy at a faster pace to combat stubbornly high inflation could act as a headwind for the non-yielding yellow metal. Hence, the market focus will remain glued to the latest US CPI report, due for release on Tuesday.
Gold: Key levels to watch
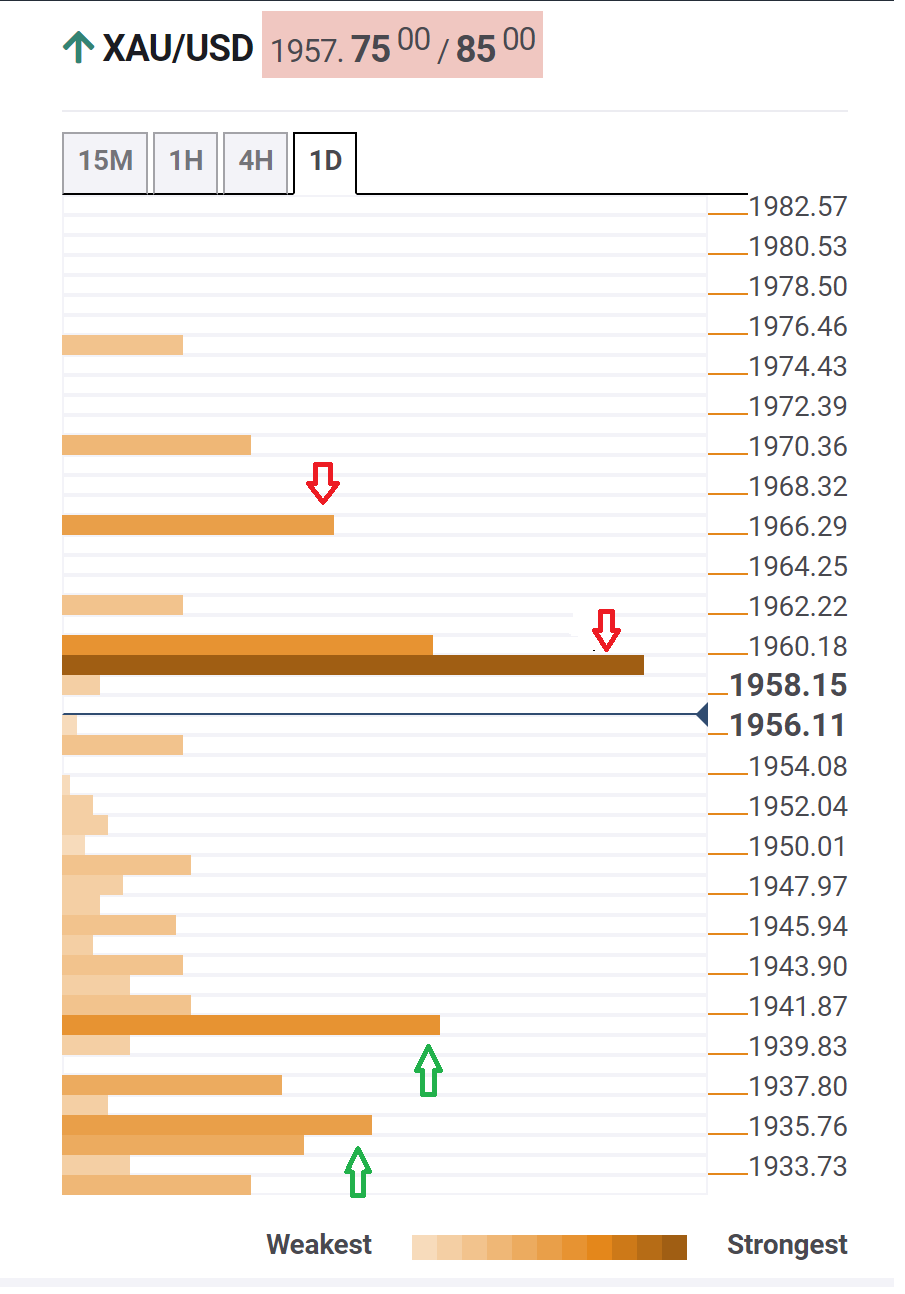
The Technical Confluences Detector shows that spot gold price was flirting with its immediate upside barrier near the $1,958-$1960 region. The said resistance is the convergence of the Fibonacci 61.8% one-month, Bollinger Band one-day Upper and Pivot Point one-week R1. The next relevant hurdle is pegged near the $1,966 zone, or the March 23 high, which if cleared should pave the way for additional near-term gains.
On the flip side, immediate support is pegged near the $1,940 area, comprising of the Fibonacci 38.2% one day and the Fibonacci 23.6% one week. This is closely followed by the Bollinger Band one-day Middle, around the $1,934 region, which if broken decisively could negate prospects for any further near-term appreciating move.
Here is how it looks on the tool
About Technical Confluences Detector
The TCD (Technical Confluences Detector) is a tool to locate and point out those price levels where there is a congestion of indicators, moving averages, Fibonacci levels, Pivot Points, etc. If you are a short-term trader, you will find entry points for counter-trend strategies and hunt a few points at a time. If you are a medium-to-long-term trader, this tool will allow you to know in advance the price levels where a medium-to-long-term trend may stop and rest, where to unwind positions, or where to increase your position size.
Author

Haresh Menghani
FXStreet
Haresh Menghani is a detail-oriented professional with 10+ years of extensive experience in analysing the global financial markets.

















