- Gold price extends previous gains, with eyes again on the $1791 level.
- Gold bulls defy the uptick in the USD, as Treasury yields pare gains.
- Gold: Sellers defend $1,800, all eyes on US T-bond yields.
Gold price is holding the higher ground, extending the previous advance amid a pullback in the US 10-year Treasury yields from five-month highs of 1.672%. However, with the risk-off mood seeping back into the market, amid mixed European corporate earnings, the US dollar is finding its feet across the board, which could likely cap the upside in gold price. In absence of the first-tier US economic data, the broader market sentiment will continue to lead the way while investors will closely follow the price action in the yields and the dollar.
Read: Gold Price Forecast: XAU/USD’s bullish potential appears limited amid bear cross, firmer yields
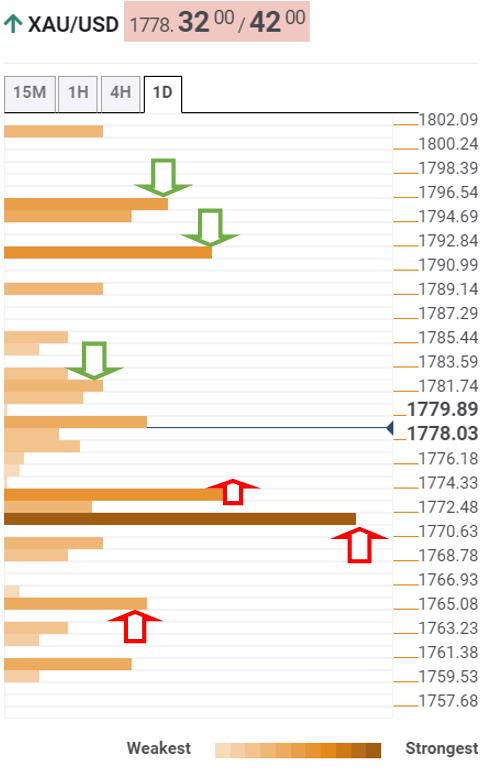
Gold Price: Key levels to watch
According to the Technical Confluences Detector, gold eyes a smooth sail towards the Fibonacci 23.6% one-week at $1789.
However, a bunch of minor resistance levels stacked up around $1783 could challenge the bullish attempts. That zone is the confluence of the Fibonacci 38.2% one-week, pivot point one-day R1 and Fibonacci 23.6% one-day.
The crucial upside target at $1791 still remains on gold buyers’ radars. That level is the intersection of the Fibonacci 61.8% one-month and Bollinger Band one-hour Upper.
Sellers will then need to the defend $1795, which is the convergence of the SMA100 and 200 one-day.
On the flip side, strong support awaits at $1774, the point where the previous low four-hour coincides with the SMA10 four-hour.
The confluence of the SMA200 four-hour, Fibonacci 61.8% one-day and SMA50 four-hour at $1771 will be the level to beat for gold bears.
The next downside target is envisioned at the Fibonacci 38.2% one-month at $1766.
Here is how it looks on the tool
About Technical Confluences Detector
The TCD (Technical Confluences Detector) is a tool to locate and point out those price levels where there is a congestion of indicators, moving averages, Fibonacci levels, Pivot Points, etc. If you are a short-term trader, you will find entry points for counter-trend strategies and hunt a few points at a time. If you are a medium-to-long-term trader, this tool will allow you to know in advance the price levels where a medium-to-long-term trend may stop and rest, where to unwind positions, or where to increase your position size.
Information on these pages contains forward-looking statements that involve risks and uncertainties. Markets and instruments profiled on this page are for informational purposes only and should not in any way come across as a recommendation to buy or sell in these assets. You should do your own thorough research before making any investment decisions. FXStreet does not in any way guarantee that this information is free from mistakes, errors, or material misstatements. It also does not guarantee that this information is of a timely nature. Investing in Open Markets involves a great deal of risk, including the loss of all or a portion of your investment, as well as emotional distress. All risks, losses and costs associated with investing, including total loss of principal, are your responsibility. The views and opinions expressed in this article are those of the authors and do not necessarily reflect the official policy or position of FXStreet nor its advertisers. The author will not be held responsible for information that is found at the end of links posted on this page.
If not otherwise explicitly mentioned in the body of the article, at the time of writing, the author has no position in any stock mentioned in this article and no business relationship with any company mentioned. The author has not received compensation for writing this article, other than from FXStreet.
FXStreet and the author do not provide personalized recommendations. The author makes no representations as to the accuracy, completeness, or suitability of this information. FXStreet and the author will not be liable for any errors, omissions or any losses, injuries or damages arising from this information and its display or use. Errors and omissions excepted.
The author and FXStreet are not registered investment advisors and nothing in this article is intended to be investment advice.
Recommended content
Editors’ Picks
EUR/USD retreats below 1.0700 after US GDP data

EUR/USD came under modest bearish pressure and retreated below 1.0700. Although the US data showed that the economy grew at a softer pace than expected in Q1, strong inflation-related details provided a boost to the USD.
GBP/USD declines below 1.2500 as USD rebounds

GBP/USD declined below 1.2500 and erased the majority of its daily gains with the immediate reaction to the US GDP report. The US economy expanded at a softer pace than expected in Q1 but the price deflator jumped to 3.4% from 1.8%.
Gold drops below $2,320 as US yields shoot higher

Gold lost its traction and turned negative on the day below $2,320 in the American session on Thursday. The benchmark 10-year US Treasury bond yield is up more than 1% on the day above 4.7% after US GDP report, weighing on XAU/USD.
XRP extends its decline, crypto experts comment on Ripple stablecoin and benefits for XRP Ledger

Ripple extends decline to $0.52 on Thursday, wipes out weekly gains. Crypto expert asks Ripple CTO how the stablecoin will benefit the XRP Ledger and native token XRP.
After the US close, it’s the Tokyo CPI

After the US close, it’s the Tokyo CPI, a reliable indicator of the national number and then the BoJ policy announcement. Tokyo CPI ex food and energy in Japan was a rise to 2.90% in March from 2.50%.