Gold melts down as blowout NFP sends DXY above 100
- XAU/USD tumbles as stellar payrolls report pushes Gold below the 200-day SMA.
- US payrolls smash forecasts, reinforcing Fed’s inflation-fighting stance.
- Treasury yields jump, dragging non-yielding Gold sharply lower.
- Hezbollah's rejection complicates US-Iran talks and ceasefire prospects.

Gold (XAU/USD) price collapses during the North American session on Friday as the latest Nonfarm Payrolls report in the US smashed forecasts, with figures for the last three months upwardly revised, increasing the chance of a Federal Reserve (Fed) rate hike. The XAU/USD pair trades at $4,336, down more than 3%.
XAU sinks as NFP shock sends US Dollar soaring
Nonfarm Payrolls in May significantly exceeded expectations, increasing by 172K—more than double the forecasted 85K—highlighting the robustness of the labor market and supporting the view that the Federal Reserve should focus on fighting inflation. Additionally, the Unemployment Rate remained steady at 4.3%, providing strong grounds for Fed officials to consider raising interest rates.
The Greenback appreciated sharply as traders expected higher US interest rates. The US Dollar Index (DXY), which measures the American Dollar's performance against six currencies, has risen 0.59% to 100.01 after bouncing from daily lows around 99.16.
US yields skyrocket as traders eye a Fed rate hike by 2026
US Treasury yields are soaring, with the 10-year Treasury note, which moves inversely with Gold prices, up nearly six basis points to 4.53%, a headwind for the yellow metal.
Beth Hammack from the Cleveland Fed was very hawkish, stating that it is “reasonable to keep rates steady for now, but if recent trades persist, it might soon be necessary to act against high inflation.”
According to Prime Terminal data, money markets assigne a 67% probability to a Federal Reserve rate increase at the December meeting. Meanwhile, traders anticipate the US central bank will hold rates steady in June.
US-Iran talks in trouble as Hezbollah rejects deal
In the Middle East, the narrative hasn’t changed, with an update that Iran is backing Lebanese allied Hezbollah in rejecting the ceasefire proposed by the US, and troubling negotiations between Washington and Tehran. Iran stated that an end to hostilities in Lebanon is required before setting out for a peace agreement with the United States.
The US-Iran war “will end only when it ends in Lebanon as well,” said Iranian Foreign Minister Abbas Araghchi. He added that the Lebanon conflict would end with the “withdrawal of Israeli forces from the territories they have occupied.”
Next week’s US economic schedule
The US docket will feature inflation data on the consumer and producer sides, as well as jobless claims.
Gold Technical Levels
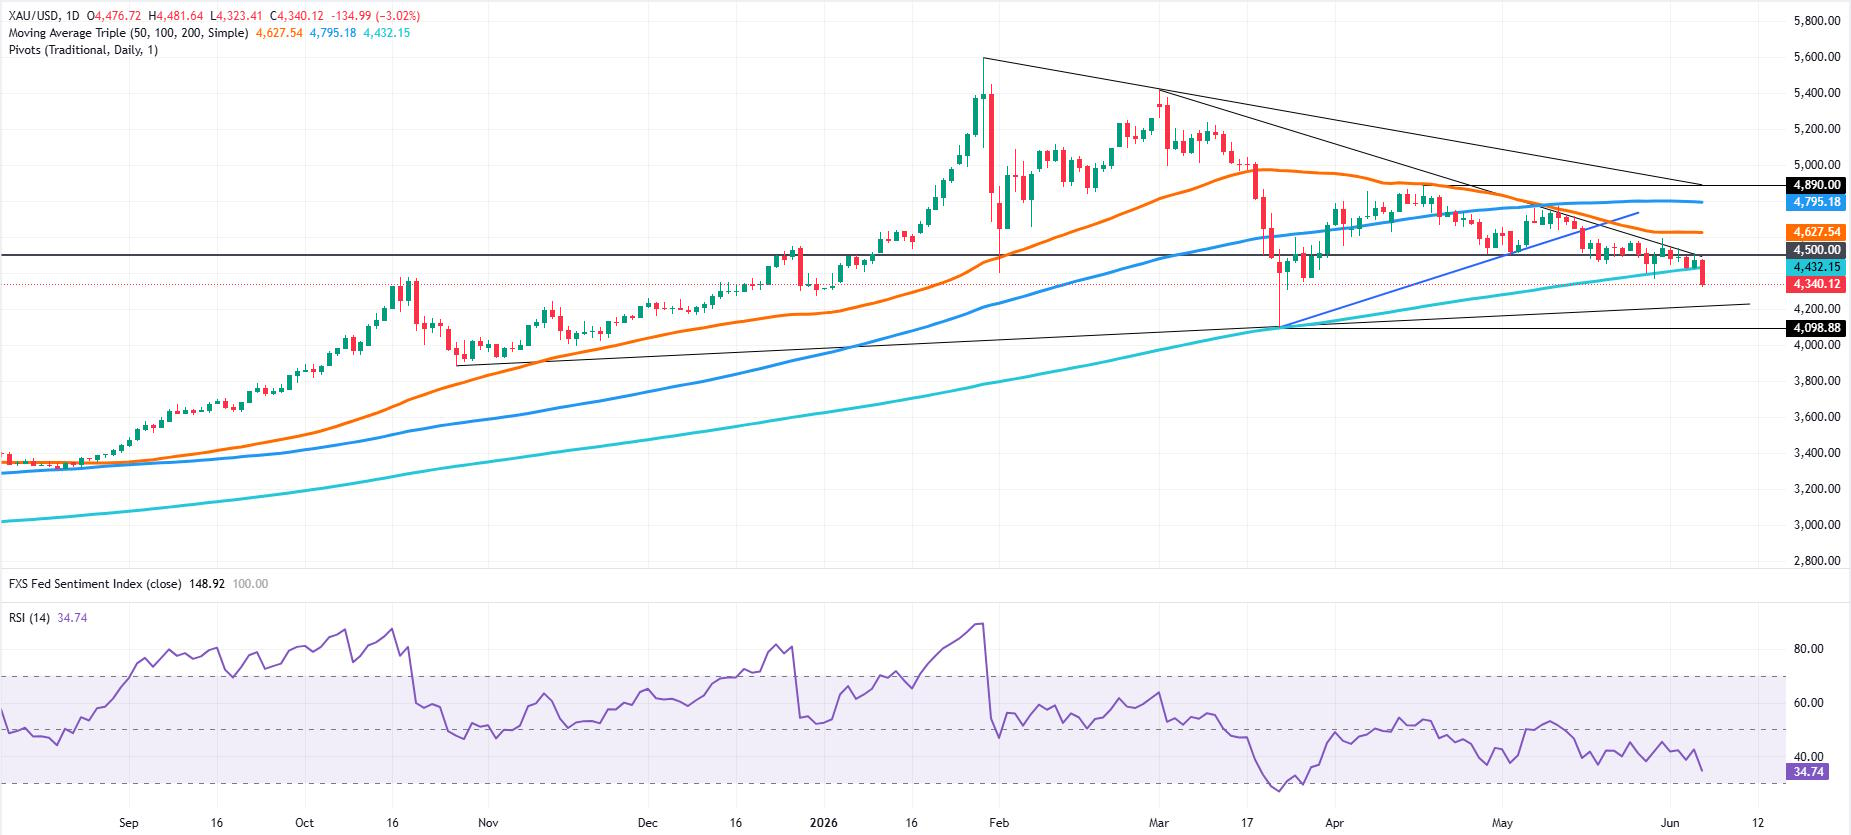
Gold price cleared the 200-day Simple Moving Average (SMA) of $4,432, an indication that the yellow metal shifted bearish from a technical standpoint.
The Relative Strength Index (RSI) shows that momentum remains bearish, but the index is accelerating towards oversold territory, a signal that sellers are gaining traction. Hence, the path of least resistance is downwards.
If XAU/USD clears the $4,300 level, the next support would be the upslope trendline from the October 2025 lows, near the $4,200-$4,230 area. Once those levels are surpassed, the next target is the March 23 cycle low at $4,098.
For a bullish recovery, Gold buyers must reclaim the 200-day SMA and the $4,450 psychological figure. Still above this area, they will meet stiff resistance at $4,500, ahead of the 50-day SMA at $4,627.
Gold FAQs
Gold has played a key role in human’s history as it has been widely used as a store of value and medium of exchange. Currently, apart from its shine and usage for jewelry, the precious metal is widely seen as a safe-haven asset, meaning that it is considered a good investment during turbulent times. Gold is also widely seen as a hedge against inflation and against depreciating currencies as it doesn’t rely on any specific issuer or government.
Central banks are the biggest Gold holders. In their aim to support their currencies in turbulent times, central banks tend to diversify their reserves and buy Gold to improve the perceived strength of the economy and the currency. High Gold reserves can be a source of trust for a country’s solvency. Central banks added 1,136 tonnes of Gold worth around $70 billion to their reserves in 2022, according to data from the World Gold Council. This is the highest yearly purchase since records began. Central banks from emerging economies such as China, India and Turkey are quickly increasing their Gold reserves.
Gold has an inverse correlation with the US Dollar and US Treasuries, which are both major reserve and safe-haven assets. When the Dollar depreciates, Gold tends to rise, enabling investors and central banks to diversify their assets in turbulent times. Gold is also inversely correlated with risk assets. A rally in the stock market tends to weaken Gold price, while sell-offs in riskier markets tend to favor the precious metal.
The price can move due to a wide range of factors. Geopolitical instability or fears of a deep recession can quickly make Gold price escalate due to its safe-haven status. As a yield-less asset, Gold tends to rise with lower interest rates, while higher cost of money usually weighs down on the yellow metal. Still, most moves depend on how the US Dollar (USD) behaves as the asset is priced in dollars (XAU/USD). A strong Dollar tends to keep the price of Gold controlled, whereas a weaker Dollar is likely to push Gold prices up.
Author

Christian Borjon Valencia
FXStreet
Markets analyst, news editor, and trading instructor with over 14 years of experience across FX, commodities, US equity indices, and global macro markets.


