Gold climbs on US-Iran ceasefire as softer Dollar, Oil lend support
- Gold stays supported as falling Oil prices weigh on the US Dollar.
- Two-week ceasefire improved sentiment, but Middle East tensions remain unresolved.
- Traders now await Fed minutes, jobless claims and Core PCE data.

Gold (XAU/USD) advances on Wednesday, yet trades off a three-week high of $4,857 hit earlier in the day, as falling Oil prices weighed on the US Dollar, which weakened to a four-week low in the US Dollar Index (DXY). At the time of writing, the XAU/USD pair trades at $4,735, up more than 0.70%.
Bullion holds firm as easing inflation fears dent greenback bid
On Tuesday, the US and Iran agreed to a two-week ceasefire, aimed to definitively end hostilities, with delegations of both countries set to meet in Pakistan on Friday. US President Donald Trump broke the news, saying the truce is subject to Iran reopening the Strait of Hormuz, and added that the US had achieved its military objectives. Trump wrote that he received a 10-point proposal from Iran and believes “it is a workable basis on which to negotiate.”
In the meantime, tensions in the Middle East remain high amid the exchange of attacks between Israel and Iran. The former is attacking Hezbollah's positions in Lebanon, while Kuwait and Saudi Arabia revealed damage in energy facilities due to attacks by Tehran.
The Iranian President Masoud Pezeshkian told Pakistan PM that a ceasefire in Lebanon is an essential condition in the framework of the 10-point agreement with the US. As of writing, the Strait of Hormuz remains shut. A senior Iranian official said that the Strait of Hormuz could reopen on Thursday or Friday ahead of US-Iran talks in Pakistan, if a ceasefire framework is reached.
Iran’s semi-official Fars News Agency reported that the passage of Oil tankers through the Strait of Hormuz is halted as retaliation for Israel's attacks on Lebanon.
The ceasefire lifted market mood, a headwind for West Texas Intermediate (WTI) Oil, which is plummeting nearly 14%, down below $95.00 per barrel. The DXY, which tracks the buck’s performance against a basket of currencies, is down 0.60% to 98.91.
Global central banks have seen reduced fears over a second wave of inflation stemming from the ongoing energy shock linked to the conflict. Prior to the US-Iran truce, money markets had been expecting the Federal Reserve (Fed) to hold rates unchanged. However, as negotiations are set to begin, investors are now pricing in nearly 10 basis points of easing by year-end, according to Prime Market Terminal.
Federal Reserve interest rate expectations
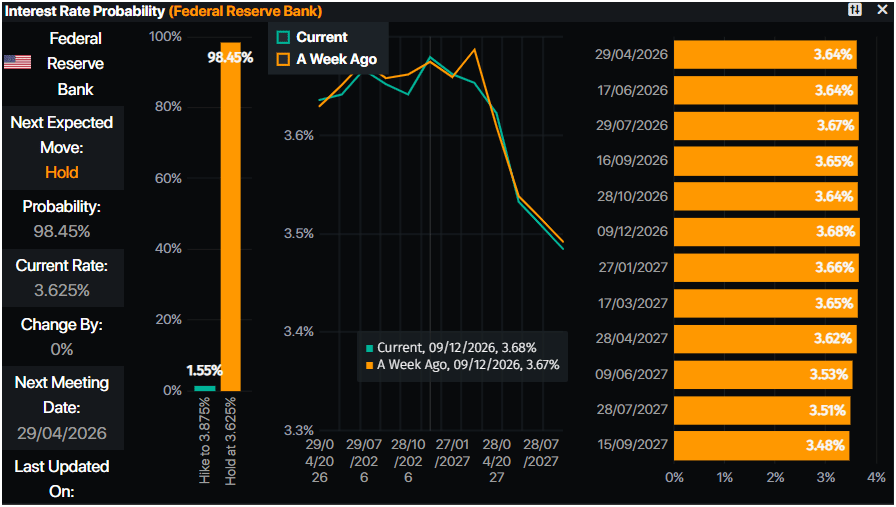
.
On Thursday, further US data is eyed, including jobless claims for the last week, the final print of the Gross Domestic Product (GDP) for Q4 2025, and the release of the Fed’s favorite inflation gauge, the Core Personal Consumption Expenditures (PCE) Price Index.
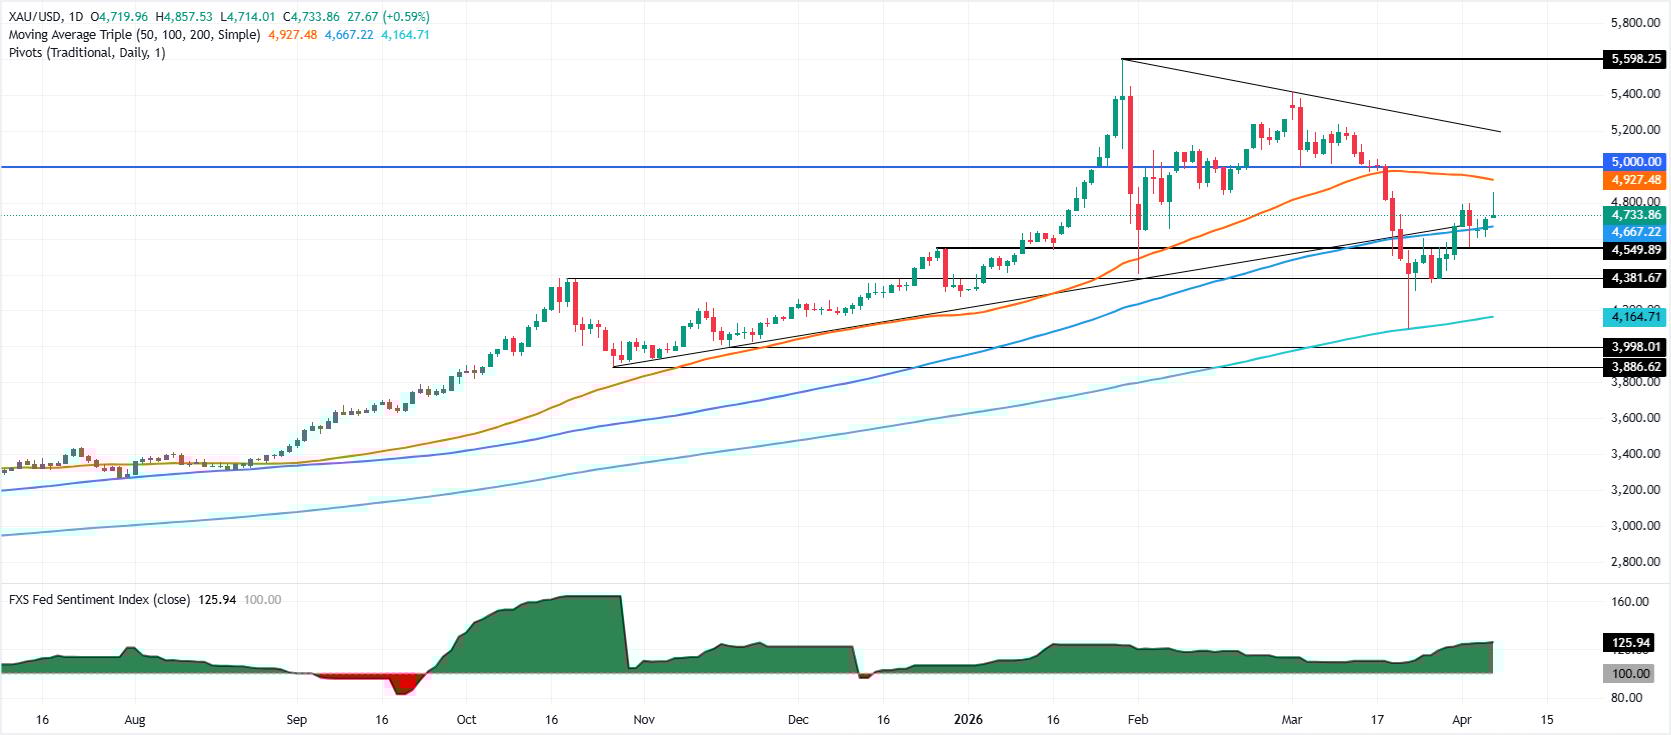
XAU/USD technical outlook: Gold uptrend at risk below 50-day SMA, bears target $4,700
The technical picture shows the Gold price remains bullish, but a failure to close daily above the 50-day Simple Moving Average (SMA) at $4,779 would open the door for a deeper pullback below the 20-day SMA at $4,723.
Although momentum seems constructive as the Relative Strength Index (RSI) rises, poised to pierce its neutral level, downside risks remain. Further uncertainty about the Mid-East ceasefire could increase volatility, and despite Gold’s haven appeal, if Oil rallies, XAU/USD could edge lower.
On the downside, if XAU/USD drops below $4,700, the next support would be the 100-day SMA at $4,620, ahead of challenging the April 2 daily low of $4,554.
Gold FAQs
Gold has played a key role in human’s history as it has been widely used as a store of value and medium of exchange. Currently, apart from its shine and usage for jewelry, the precious metal is widely seen as a safe-haven asset, meaning that it is considered a good investment during turbulent times. Gold is also widely seen as a hedge against inflation and against depreciating currencies as it doesn’t rely on any specific issuer or government.
Central banks are the biggest Gold holders. In their aim to support their currencies in turbulent times, central banks tend to diversify their reserves and buy Gold to improve the perceived strength of the economy and the currency. High Gold reserves can be a source of trust for a country’s solvency. Central banks added 1,136 tonnes of Gold worth around $70 billion to their reserves in 2022, according to data from the World Gold Council. This is the highest yearly purchase since records began. Central banks from emerging economies such as China, India and Turkey are quickly increasing their Gold reserves.
Gold has an inverse correlation with the US Dollar and US Treasuries, which are both major reserve and safe-haven assets. When the Dollar depreciates, Gold tends to rise, enabling investors and central banks to diversify their assets in turbulent times. Gold is also inversely correlated with risk assets. A rally in the stock market tends to weaken Gold price, while sell-offs in riskier markets tend to favor the precious metal.
The price can move due to a wide range of factors. Geopolitical instability or fears of a deep recession can quickly make Gold price escalate due to its safe-haven status. As a yield-less asset, Gold tends to rise with lower interest rates, while higher cost of money usually weighs down on the yellow metal. Still, most moves depend on how the US Dollar (USD) behaves as the asset is priced in dollars (XAU/USD). A strong Dollar tends to keep the price of Gold controlled, whereas a weaker Dollar is likely to push Gold prices up.
Author

Christian Borjon Valencia
FXStreet
Markets analyst, news editor, and trading instructor with over 14 years of experience across FX, commodities, US equity indices, and global macro markets.


