Germany’s Factory Orders fall 3.8% MoM in April: What they mean for the Euro?

Germany's Factory Orders fell in April, suggesting that the country’s manufacturing sector activity lost momentum, according to the official data published by the Federal Statistics Office on Monday.
Over the month, contracts for goods ‘Made in Germany’ dropped by 3.8% in April after rising by a revised 4.5% in March. Data missed the estimated 1.2% decrease.
Germany’s Factory Orders increased by 1.6% year-over-year (YoY) in April, as against the previous rise of 4.5% (revised from 5.0%).
The Euro (EUR) edges slightly lower in an immeidate reaction to the downbeat Germany’s Factory Orders data. The EUR/USD pair remains on the defensive near monthly low around 1.1520, as of writing.
What do Germany’s Factory Orders data mean for the Euro?
The Factory orders released by the Deutsche Bundesbank are an indicator that includes shipments, inventories, and new and unfilled orders. An increase in the factory order total may indicate an expansion in the German economy and could be an inflationary factor.
Germany accounts for a significant share of the Eurozone's industrial output. Weaker-than-expected Factory Orders data may indicate slowing manufacturing activity and markets may increase bets on the European Central Bank (ECB) rate cuts or a more dovish policy stance.
Euro Price Today
The table below shows the percentage change of Euro (EUR) against listed major currencies today. Euro was the weakest against the Japanese Yen.
| USD | EUR | GBP | JPY | CAD | AUD | NZD | CHF | |
|---|---|---|---|---|---|---|---|---|
| USD | 0.02% | 0.13% | -0.03% | 0.08% | 0.11% | -0.05% | 0.19% | |
| EUR | -0.02% | 0.10% | -0.07% | 0.05% | 0.07% | -0.05% | 0.15% | |
| GBP | -0.13% | -0.10% | -0.17% | -0.05% | -0.07% | -0.17% | 0.03% | |
| JPY | 0.03% | 0.07% | 0.17% | 0.08% | 0.11% | 0.00% | 0.18% | |
| CAD | -0.08% | -0.05% | 0.05% | -0.08% | 0.03% | -0.09% | 0.09% | |
| AUD | -0.11% | -0.07% | 0.07% | -0.11% | -0.03% | -0.11% | 0.09% | |
| NZD | 0.05% | 0.05% | 0.17% | -0.01% | 0.09% | 0.11% | 0.17% | |
| CHF | -0.19% | -0.15% | -0.03% | -0.18% | -0.09% | -0.09% | -0.17% |
The heat map shows percentage changes of major currencies against each other. The base currency is picked from the left column, while the quote currency is picked from the top row. For example, if you pick the Euro from the left column and move along the horizontal line to the US Dollar, the percentage change displayed in the box will represent EUR (base)/USD (quote).
Technical Analysis: EUR/USD remains bearish, capping under the key 100-day SMA
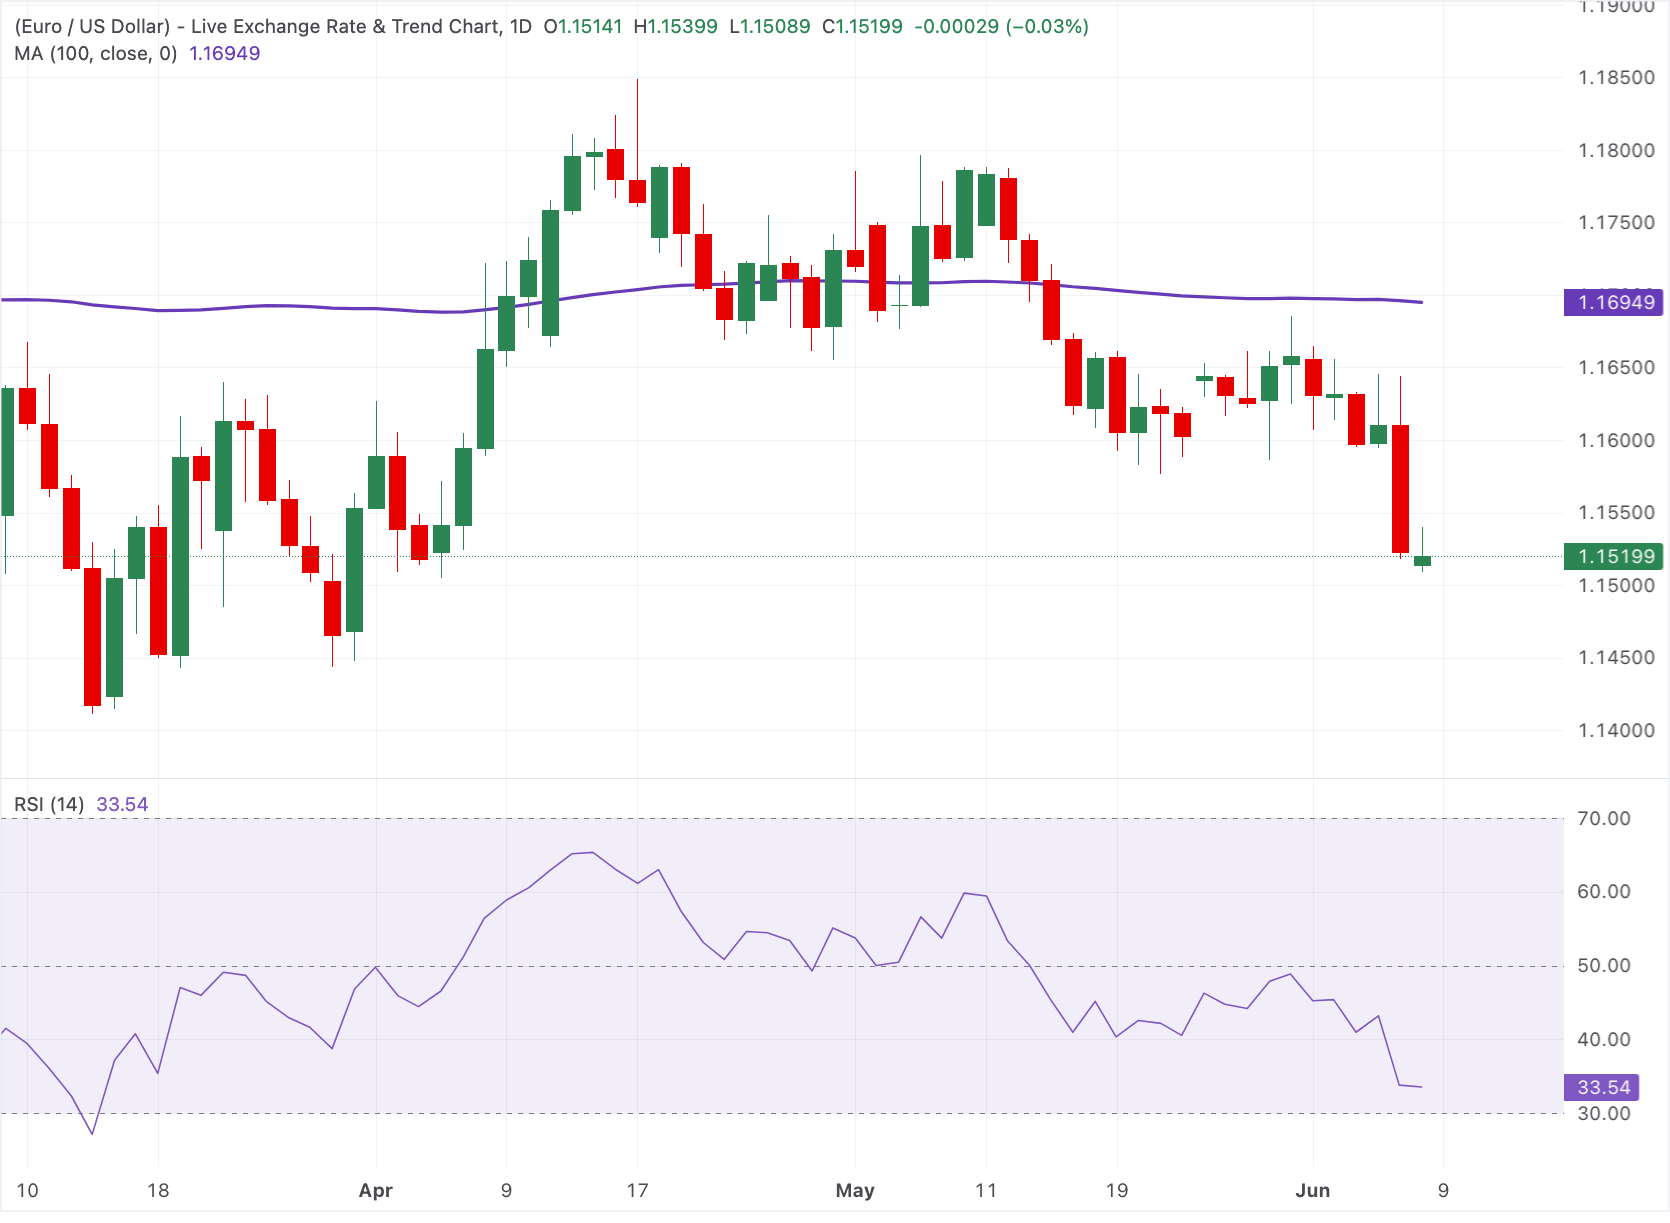
In the daily chart, EUR/USD retains a bearish near-term bias as it holds well below the 100-day Simple Moving Average (SMA), keeping the broader tone pressured despite a recent slowdown in downside momentum. The Relative Strength Index (14) hovers in the low-30s, suggesting oversold conditions that could temper immediate selling but not yet signal a sustainable recovery while price remains capped under the 100-day SMA.
On the topside, initial resistance is located at the 100-day SMA near 1.1695, and a daily close above this barrier would be needed to ease downside pressure and open the way for a more meaningful rebound. Until that hurdle is reclaimed, the absence of nearby structural supports on the daily chart leaves EUR/USD vulnerable to further declines, with any bounces likely to be viewed as corrective within the prevailing downtrend.
(The technical analysis of this story was written with the help of an AI tool.)
Economic Indicator
Factory Orders s.a. (MoM)
The Factory orders released by the Deutsche Bundesbank is an indicator that includes shipments, inventories, and new and unfilled orders. An increase in the factory order total may indicate an expansion in the German economy and could be an inflationary factor. It is worth noting that the German Factory barely influences, either positively or negatively, the total Eurozone GDP. A high reading is positive (or bullish) for the EUR, while a low reading is negative.
Read more.Last release: Mon Jun 08, 2026 06:00
Frequency: Monthly
Actual: -3.8%
Consensus: -1.2%
Previous: 5%
Euro FAQs
The Euro is the currency for the 20 European Union countries that belong to the Eurozone. It is the second most heavily traded currency in the world behind the US Dollar. In 2022, it accounted for 31% of all foreign exchange transactions, with an average daily turnover of over $2.2 trillion a day. EUR/USD is the most heavily traded currency pair in the world, accounting for an estimated 30% off all transactions, followed by EUR/JPY (4%), EUR/GBP (3%) and EUR/AUD (2%).
The European Central Bank (ECB) in Frankfurt, Germany, is the reserve bank for the Eurozone. The ECB sets interest rates and manages monetary policy. The ECB’s primary mandate is to maintain price stability, which means either controlling inflation or stimulating growth. Its primary tool is the raising or lowering of interest rates. Relatively high interest rates – or the expectation of higher rates – will usually benefit the Euro and vice versa. The ECB Governing Council makes monetary policy decisions at meetings held eight times a year. Decisions are made by heads of the Eurozone national banks and six permanent members, including the President of the ECB, Christine Lagarde.
Eurozone inflation data, measured by the Harmonized Index of Consumer Prices (HICP), is an important econometric for the Euro. If inflation rises more than expected, especially if above the ECB’s 2% target, it obliges the ECB to raise interest rates to bring it back under control. Relatively high interest rates compared to its counterparts will usually benefit the Euro, as it makes the region more attractive as a place for global investors to park their money.
Data releases gauge the health of the economy and can impact on the Euro. Indicators such as GDP, Manufacturing and Services PMIs, employment, and consumer sentiment surveys can all influence the direction of the single currency. A strong economy is good for the Euro. Not only does it attract more foreign investment but it may encourage the ECB to put up interest rates, which will directly strengthen the Euro. Otherwise, if economic data is weak, the Euro is likely to fall. Economic data for the four largest economies in the euro area (Germany, France, Italy and Spain) are especially significant, as they account for 75% of the Eurozone’s economy.
Another significant data release for the Euro is the Trade Balance. This indicator measures the difference between what a country earns from its exports and what it spends on imports over a given period. If a country produces highly sought after exports then its currency will gain in value purely from the extra demand created from foreign buyers seeking to purchase these goods. Therefore, a positive net Trade Balance strengthens a currency and vice versa for a negative balance.
Author

Lallalit Srijandorn
FXStreet
Lallalit Srijandorn is a Parisian at heart. She has lived in France since 2019 and now becomes a digital entrepreneur based in Paris and Bangkok.


