GDXJ: The bigger the base, the higher in space

Two decades ago, while reading the outstanding Technical Research “Market Interpretations” from Louise Yamada and her team, I came across “The Technician’s creed – in price there is knowledge” where one of the assumptions of technical analysis is that periods of accumulation precede uptrends, and periods of distribution precede downtrends; additionally, that the size, or extent, of an accumulation or distribution tends to have a relationship to any ensuing advance or decline. In other words, trends tend to have relationships to another. Simplistically said, the bigger the base, the higher in space; the bigger the top, the bigger the drop; and the bigger the drop, the longer the need for repair…
With that in mind, here’s a monthly chart of the VanEck Junior Gold Miners ETF (GDXJ), which has been building a base for the past twelve years! GDXJ was indeed in need of repair after its drop from its 2011 highs.
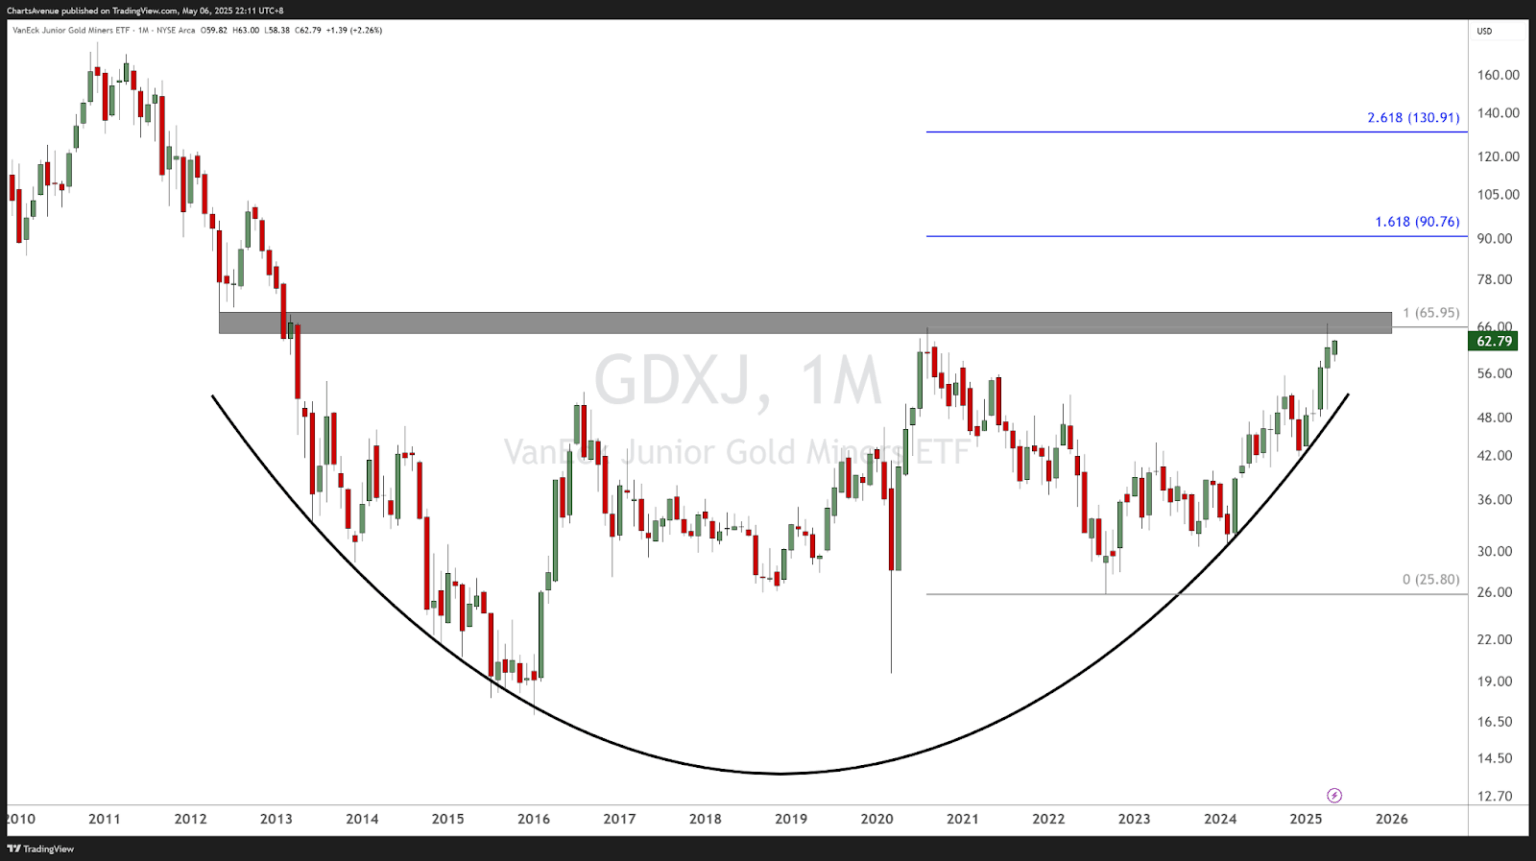
Now, I will not get ahead of myself with a stratospheric price target, especially when the price has not even broken out of its resistance yet… Therefore I will go for a down-to-earth target by using the Fibonacci extension levels from the last meaningful pullback, i.e. August 2020 high to September 2022 low, which projects a first target just under $91. But again, first things first, I will let the price break out of its base before acting on it. For that to happen, the price needs to get above $66 on a monthly closing basis.
TRV: Fibonacci guides the current uptrend
The monthly chart of Travelers Companies (TRV) shows an impressive adherence to the Fibonacci extension levels, anchored from the September 2008 high to the October 2008 low.
In March 2020, TRV bottomed 5 cents away from a Fibonacci extension, marking a significant turning point. Since that low, the stock has been in a strong uptrend.
One interesting feature is the behavior around the 4.236 Fibonacci extension (~$155), which initially acted as stiff resistance in early 2018, mid 2019 and 2021 spending most of its year around that level. After a decisive breakout above this $155 area, it flipped to become a reliable support, being tested a few times in 2022 and again in 2023, reinforcing the strength of the uptrend as the price keeps making a series of higher highs and higher lows.
The RSI remains in a bullish regime (more on that in Friday’s edition – but in short, when the RSI doesn’t go below a certain level during pullbacks, it is known to be in a bullish regime).
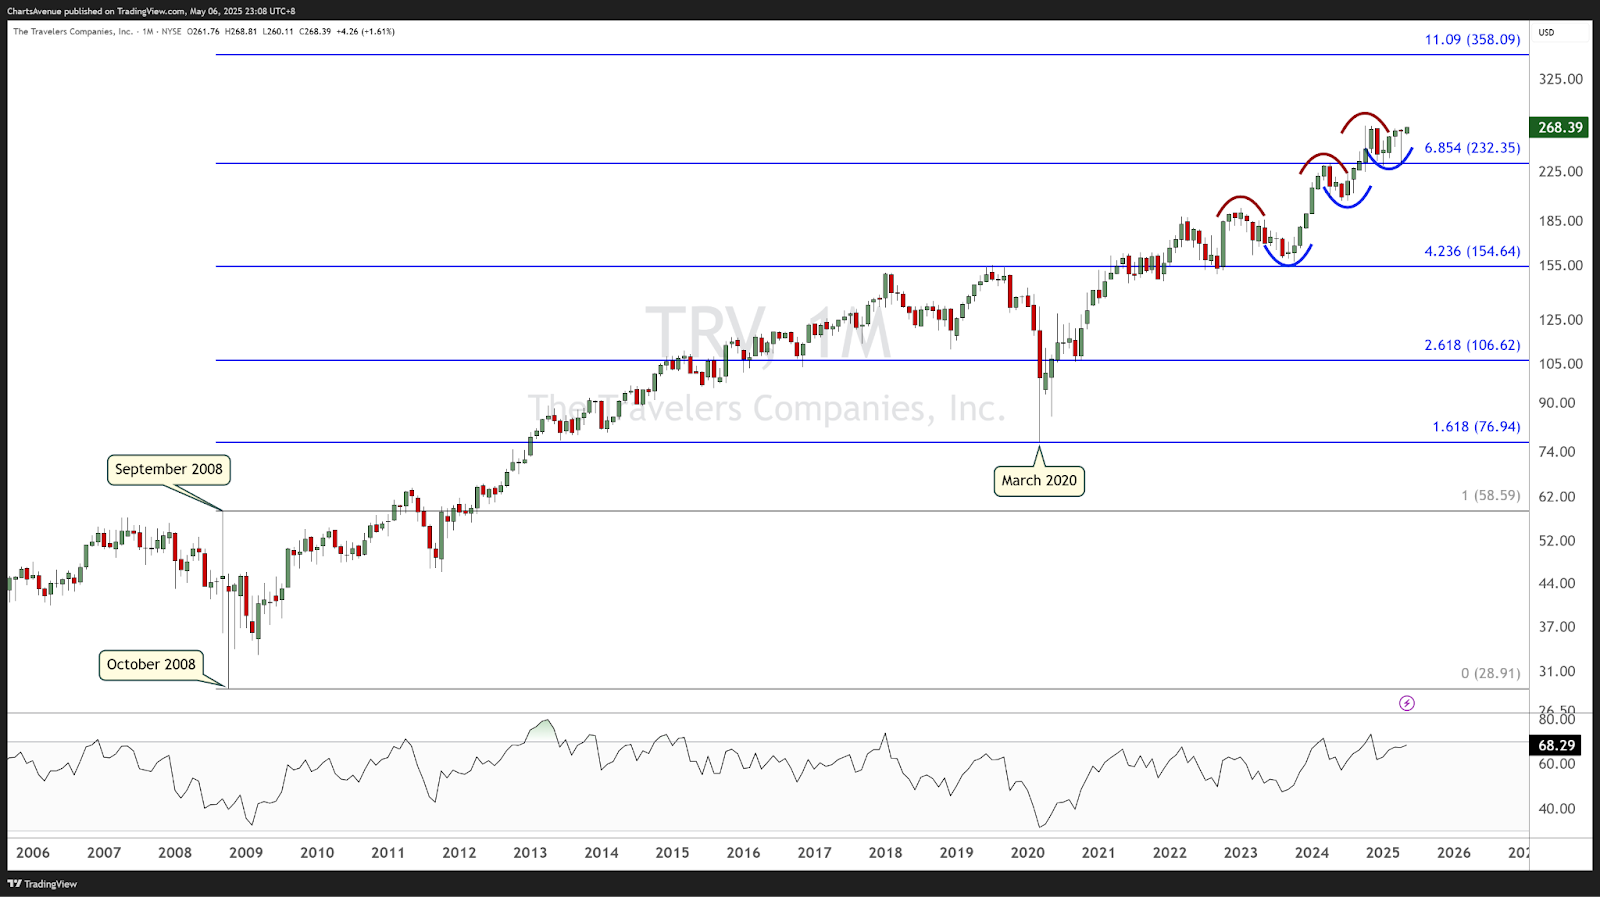
TRV is now eyeing the next major extension at the 11.09 Fibonacci level (~$358), which serves as a long-term upside target.
ITB breaks down after bearish divergence flags trend shift
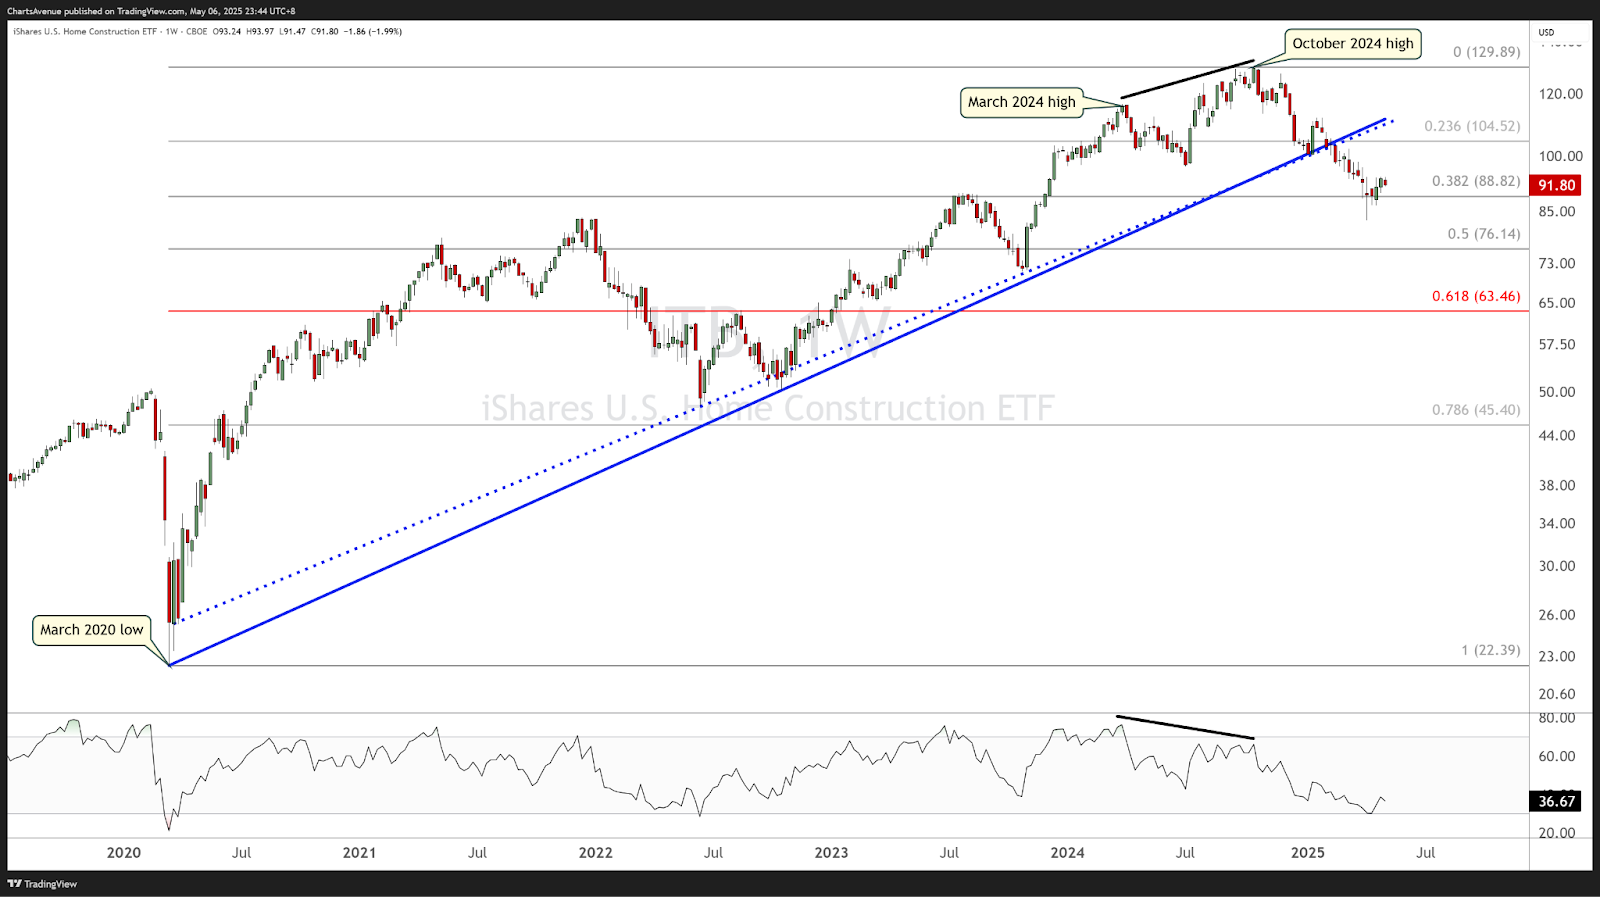
The weekly chart of the iShares U.S. Home Construction ETF (ITB) illustrates a trend reversal following a multi-year uptrend from the March 2020 low to the October 2024 high.
During its ascent, ITB was well-supported by two distinct trendlines:
-
A dotted blue trendline connecting the lows of the candle bodies,
-
A solid blue trendline tracing the lows of the wicks/shadows.
Both trendlines offered reliable support, reflecting a healthy uptrend. However, an early warning sign emerged in 2024: a bearish divergence developed on the RSI between the March 2024 high and the October 2024 high. Although the price made a higher high in October, the RSI posted a lower high, signaling that the upward momentum was weakening despite rising prices. This divergence is a classic indicator that buyers are losing strength and that a potential reversal could be on the horizon.
By early 2025, the price broke below the trendlines, confirming a shift in the market structure. The ETF is now consolidating near the 38.2% Fibonacci retracement (~$88.80), drawn from the 2020 low to the 2024 peak.
Bottom line:
The breakdown below both trendlines, coupled with the prior RSI bearish divergence, confirms that ITB’s primary uptrend has reversed. The $88 support should be watched closely: a sustained breach could trigger deeper pullbacks toward the 50% and 61.8% Fibonacci levels.
Unlock exclusive gold and silver trading signals and updates that most investors don’t see. Join our free newsletter now!
Unlock exclusive gold and silver trading signals and updates that most investors don’t see. Join our free newsletter now!
Author

CMT Association Research Team
CMT Association
The CMT Association is a global credentialing body that has served the financial industry for nearly 50 years.


