GBP/USD steadies near 1.3500 as Hormuz tensions curb upside
- GBP/USD is weighed by geopolitical risks front and center.
- Strong US and UK PMIs showed activity holding up despite Iran’s war shock.
- BoE hike bets and softer Oil prices helped Sterling hold near 1.3500.

GBP/USD steadies at around 1.3500 on Thursday as tensions in the Middle East rise, with the US and Iran escalating the conflict as both began to seize ships or Oil vessels near the Strait of Hormuz. Meanwhile, a Pakistani official revealed that negotiations between Washington and Tehran had frozen.
Strong PMIs on both sides leave Sterling hostage to headlines now
Recently, US forces intercepted two Iranian Oil supertankers that tried to avoid the blockade. In the meantime, Oil prices are retreating somewhat, easing pressure on Wall Street, with the S&P 500 and the Nasdaq turning green, even though the latest earnings reports on AI-related companies disappointed investors.
Economic data has taken a back seat as geopolitical headlines drive price action. S&P Global revealed that business activity in the US improved in April, with the manufacturing index rising from 52.3 to 54, and the Services PMI expanding from 49.8 to 51.3, both readings exceeding estimates.
Earlier, the US Department of Labor reported that the number of Americans applying for unemployment benefits rose slightly. Initial Jobless Claims exceeded forecasts of 212K, coming in at 214K, up from an upwardly revised previous print of 208K.
In the UK, the S&P Global Composite PMI improved from 50.3 to 52, with both the manufacturing and services sectors rising above the expansion/contraction threshold. Worth noting that the S&P Global report and the CBI survey revealed that input prices are increasing, spurred by the Iran war.
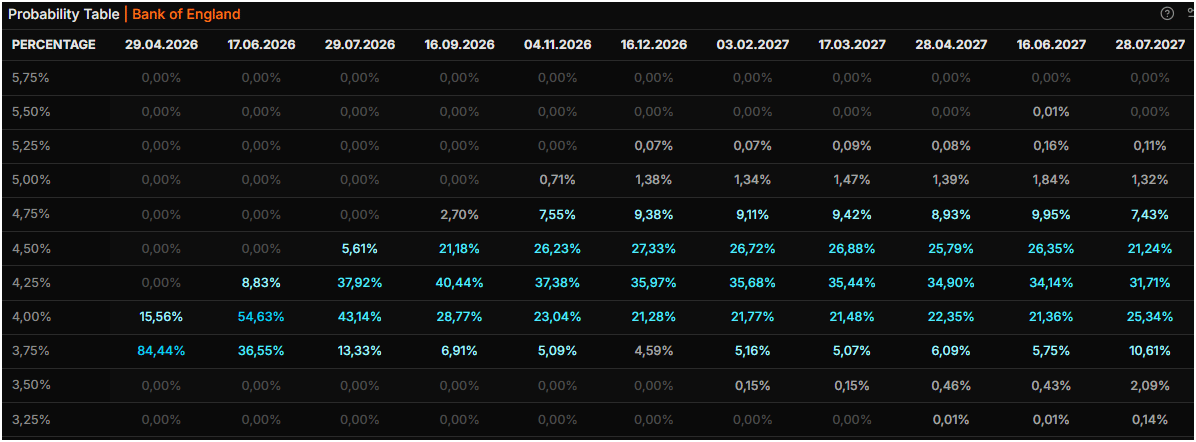
Meanwhile, the Bank of England (BoE) is expected to hold rates unchanged at 3.75% at its next meeting. Moving forward, the swaps market is pricing in a nearly 55% chance of a rate hike at the June 17 meeting and expects peak rates around 4.25% by December.
BoE interest rate probability table
What’s in the schedule for Friday?
The UK docket will feature Retail Sales, which are expected to improve from a 0.4% contraction to a 0.2% growth MoM. In the twelve months to March, sales are projected to slow from 2.5% to 1.3%.
In the US, traders will eye the final revision of the University of Michigan Consumer Sentiment reading for April.
GBP/USD Price Forecast: Technical outlook
In the daily chart, GBP/USD trades at 1.3495. The pair holds above the simple moving average cluster around 1.3414, keeping the near-term bias constructive while it grinds higher within a broader downward-sloping resistance structure. The opposing trend lines, with an established support trend line now projecting a potential break zone near 1.3861 and a longer-standing descending resistance line drawn from the 1.3869 area, suggest that upside momentum is advancing but still operating inside a medium-term corrective channel.
On the topside, initial resistance is seen near the former uptrend break zone at 1.3861, followed closely by the descending trend-line barrier drawn from around 1.3869, where sellers could reassert control if tested. On the downside, immediate support is provided by the latest close itself at 1.3495, ahead of the simple moving averages clustered near 1.3414; a break below there would expose deeper structural support closer to 1.2996, where the lower boundary of the broader range emerges.
(The technical analysis of this story was written with the help of an AI tool.)
Pound Sterling Price Today
The table below shows the percentage change of British Pound (GBP) against listed major currencies today. British Pound was the strongest against the New Zealand Dollar.
| USD | EUR | GBP | JPY | CAD | AUD | NZD | CHF | |
|---|---|---|---|---|---|---|---|---|
| USD | 0.02% | 0.06% | -0.03% | 0.09% | 0.07% | 0.46% | -0.03% | |
| EUR | -0.02% | 0.06% | -0.06% | 0.07% | 0.02% | 0.44% | -0.07% | |
| GBP | -0.06% | -0.06% | -0.09% | 0.02% | -0.01% | 0.40% | -0.12% | |
| JPY | 0.03% | 0.06% | 0.09% | 0.11% | 0.11% | 0.47% | -0.01% | |
| CAD | -0.09% | -0.07% | -0.02% | -0.11% | -0.01% | 0.37% | -0.15% | |
| AUD | -0.07% | -0.02% | 0.00% | -0.11% | 0.00% | 0.41% | -0.14% | |
| NZD | -0.46% | -0.44% | -0.40% | -0.47% | -0.37% | -0.41% | -0.53% | |
| CHF | 0.03% | 0.07% | 0.12% | 0.01% | 0.15% | 0.14% | 0.53% |
The heat map shows percentage changes of major currencies against each other. The base currency is picked from the left column, while the quote currency is picked from the top row. For example, if you pick the British Pound from the left column and move along the horizontal line to the US Dollar, the percentage change displayed in the box will represent GBP (base)/USD (quote).
Author

Christian Borjon Valencia
FXStreet
Markets analyst, news editor, and trading instructor with over 14 years of experience across FX, commodities, US equity indices, and global macro markets.


