|

GBP/USD stays firm at around 1.2160s post US CPI

  • The GBP/USD holds to its early gains in a volatile trading session.
  • US inflation rose above estimates but cooled compared to December’s data.
  • GBP/USD Price Analysis: It could resume its uptrend if it conquers 1.2200.

The GBP/USD dropped sharply in the North American session following the release of inflation data in the United States, which, although increased, initially sent the GBP/USD spiking towards its daily high at 1.2269 before reversing its course to the 1.2130 area. However, a late bounce sparked a recovery in the GBP/USD, trading at 1.2166, above its opening price.

US CPI cooled on an annual basis but was higher than forecasts

US inflation reported by the Department of Labor (DoL) showed that the Consumer Price Index (CPI) for January rose by 6.4% YoY, above estimates of 6.2%, while core CPI jumped to 5.6% YoY, against data estimated at 5.5%. Monthly basis readings were in line with estimates.

After the data release, US Treasury bond yields advanced, with the US 2-year Treasury bond yield edging towards 4.622%, as an initial reaction to the data, which warrants further tightening by the US Federal Reserve (Fed). Consequently, the greenback advanced, with the US Dollar Index (DXY) peaking at around 103.83 before reversing its course, toward the 103.09 area.

In the meantime, the swaps markets estimate the Fed would hike rates until the 5%-5.25% range, and then some cuts are expected by the end of the year.

Across the pond, data from the United Kingdom (UK), capped the Pound Sterling (GBP) fall vs. the US Dollar (USD). According to Reuters, wages in Britain grew quickly in the last quarter of 2022, keeping the Bank of England (BoE), pressured. Investors increased “slightly” their bets that the BoE would raise rates by 25 bps at their March meeting.

Elsewhere, Fed officials led by Thomas Barkin from the Richmond Fed are crossing the wires. Commented that the inflation report was “about as expected,” adding that inflation, although normalizing, it’s doing it slowly. Therefore, Barkin said there’s a good cause for leaving rates higher for a longer period.

GBP/USD Technical analysis

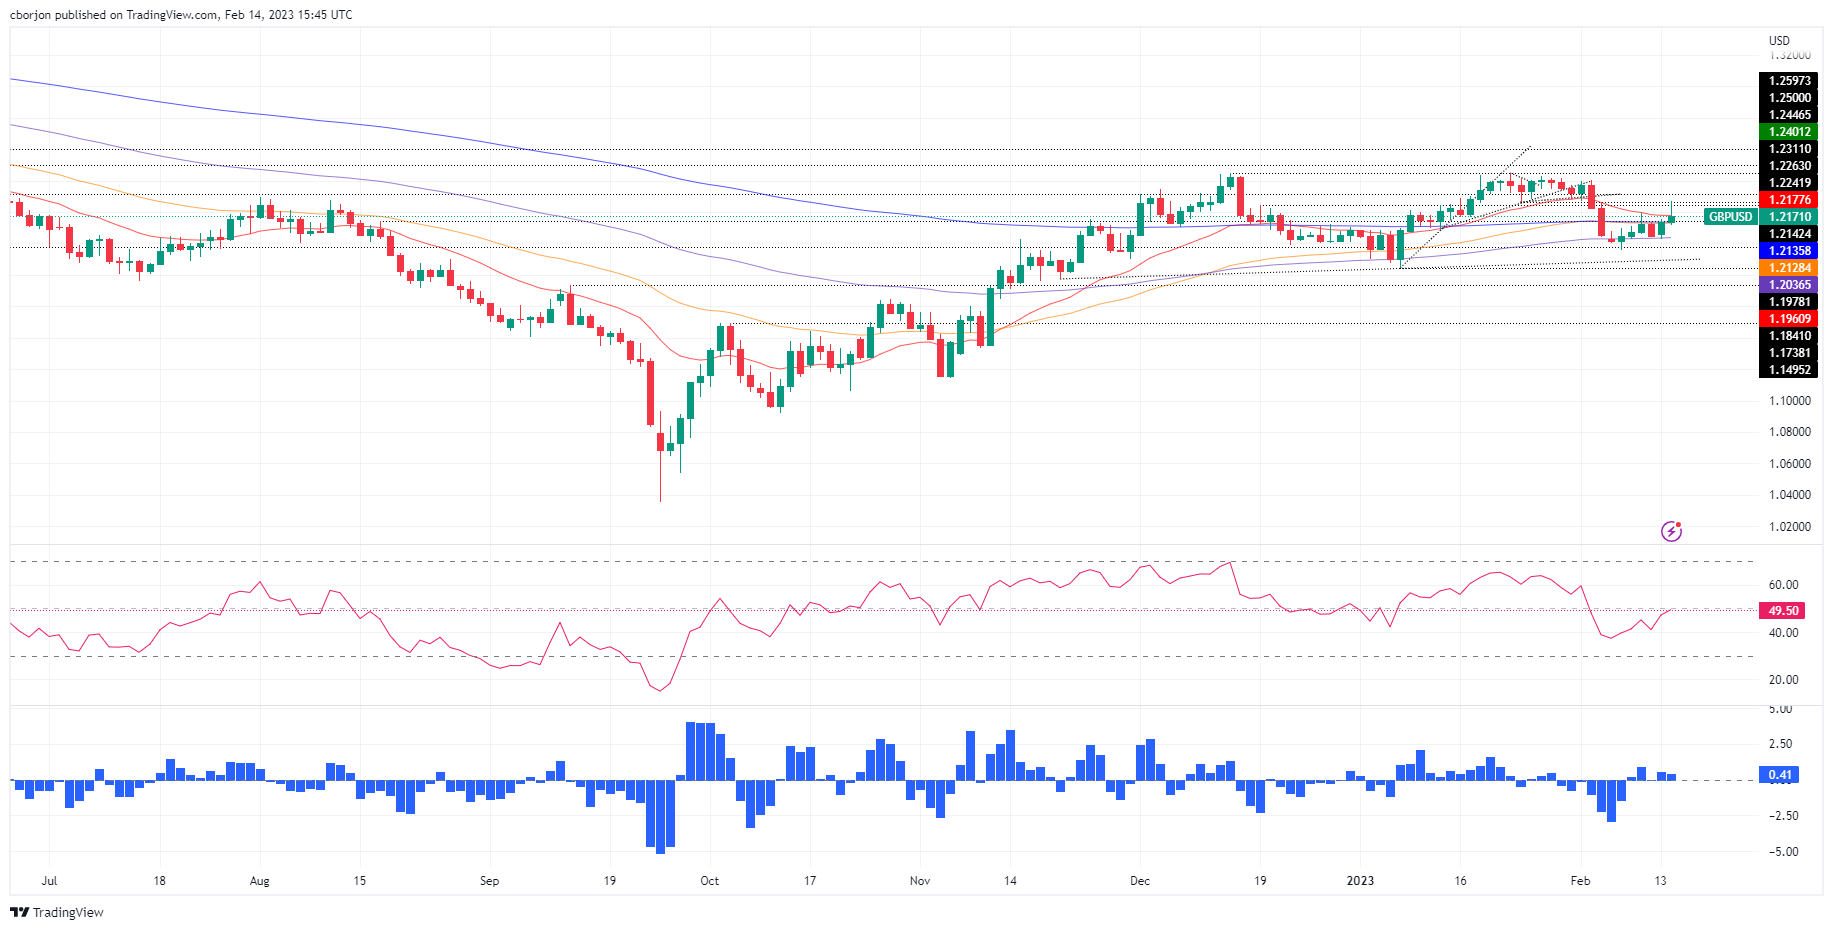
From a technical perspective, the GBP/USD daily chart suggests the pair is neutral to upward biased. Upward continuation will resume if the GBP/USD clears the 1.2200 figure, which could lift the major towards the February high of 1.2401. Firstly, it needs to hurdle the psychological 1.2300 barrier. On the flip side, a GBP/USD fall underneath the 20-day EMA at 1.2179 would expose the confluence of the 200/50-day EMA at 1.2136/1.2128, respectively, ahead of falling to 1.21000.
GBP/USD

Overview
Today last price1.2205
Today Daily Change0.0067
Today Daily Change %0.55
Today daily open1.2138
 
Trends
Daily SMA201.2254
Daily SMA501.2186
Daily SMA1001.1859
Daily SMA2001.1944
 
Levels
Previous Daily High1.2152
Previous Daily Low1.2031
Previous Weekly High1.2194
Previous Weekly Low1.1961
Previous Monthly High1.2448
Previous Monthly Low1.1841
Daily Fibonacci 38.2%1.2106
Daily Fibonacci 61.8%1.2077
Daily Pivot Point S11.2062
Daily Pivot Point S21.1986
Daily Pivot Point S31.1941
Daily Pivot Point R11.2183
Daily Pivot Point R21.2228
Daily Pivot Point R31.2304

Author

Christian Borjon Valencia

Markets analyst, news editor, and trading instructor with over 14 years of experience across FX, commodities, US equity indices, and global macro markets.


More from Christian Borjon Valencia
Share:

Editor's Picks

GBP/USD holds above 1.3350 with the 200-day SMA capping gains

The British Pound appreciates against the US Dollar on Tuesday to trim previous losses and return to the 1.3375 area, aiming to retest resistance at the key 200-day Simple Moving Average. This is a popular indicator, which lies a few pips below 1.3400 and has been capping Pound’s recovery over the last two weeks.

EUR/USD consolidates gains above 1.1400

Following an earlier move to multi-day peaks past 1.1460, EUR/USD has now slipped back toward the low 1.1400s as the NA session draws to a close on Tuesday. Declining bets for potential Fed tightening later in the year coupled with poor US CPI data hurt the US Dollar, lending fresh legs to the pair and the broader risk-linked universe. Moving forward, the release of US PPI and Chair Warsh’s second testumony should keep investors entertained on Wednesday.

Gold bulls seem hesitant near $4,050 as Iran risks support USD despite reduced Fed hike bets

Gold steadies following the previous day's late pullback from $4,100 as reduced bets for a Fed rate hike keep the US Dollar on the back foot and support the non-yielding bullion. However, escalating US-Iran tensions keep the geopolitical risk premium in play and help the USD to hold above a multi-week low, touched after softer US consumer inflation figures on Tuesday. This acts as a headwind for the precious metal, warranting caution for aggressive bulls.

Ethereum climbs 7% amid declining inflation, weak retail and whale participation

Ethereum jumped more than 7% above $1,850 on Tuesday following a weaker-than-expected US Consumer Price Index report for June. The inflation data fell to 3.5% below expectations of 3.8%, marking a month-on-month decline of 0.4%, its largest monthly drop since May 2020. Core CPI also fell to 2.6% below forecasts of 2.8%.

Fed Chair Warsh reaffirms they will deliver price stability

While testifying on the Semiannual Monetary Policy Report before the US House Financial Services Committee, Fed Chairman Kevin Warsh reiterated that the Fed is making a commitment on price stability and the goal of 2% inflation.

Five sessions, one round trip: Why the whipsaw is exactly what Warsh ordered

Markets opened July with a December hike as the base case and spent five trading sessions unlearning and relearning it. A 57K payrolls print bled the tightening bets out of the strip; a re-shut Strait of Hormuz is pushing them back in. Wednesday's minutes from the June FOMC meeting landed mid-round-trip, describing a world that had already stopped existing.















