GBP/USD Price Forecast: 61.8% Fibo retracement near 1.3600 remains key barrier
- GBP/USD slumps to near 1.3570 as renewed US-Iran tensions have improved the US Dollar’s safe-haven appeal.
- Investors await the US CPI data for April and the UK flash Q1 GDP data.
- British Pound bulls continue to face pressure near the 61.8% Fibo retracement at around 1.3600.

The GBP/USD pair is down 0.3% to near 1.3570 during the European trading session on Tuesday. The Cable faces selling pressure as the US Dollar (USD) outperforms its peers due to a risk-off market mood.
US Dollar Price Today
The table below shows the percentage change of US Dollar (USD) against listed major currencies today. US Dollar was the strongest against the Australian Dollar.
| USD | EUR | GBP | JPY | CAD | AUD | NZD | CHF | |
|---|---|---|---|---|---|---|---|---|
| USD | 0.25% | 0.38% | 0.09% | 0.12% | 0.42% | 0.29% | 0.25% | |
| EUR | -0.25% | 0.13% | -0.09% | -0.16% | 0.16% | 0.02% | 0.00% | |
| GBP | -0.38% | -0.13% | -0.23% | -0.30% | 0.03% | -0.10% | -0.13% | |
| JPY | -0.09% | 0.09% | 0.23% | -0.07% | 0.23% | 0.12% | 0.07% | |
| CAD | -0.12% | 0.16% | 0.30% | 0.07% | 0.30% | 0.18% | 0.13% | |
| AUD | -0.42% | -0.16% | -0.03% | -0.23% | -0.30% | -0.12% | -0.17% | |
| NZD | -0.29% | -0.02% | 0.10% | -0.12% | -0.18% | 0.12% | -0.04% | |
| CHF | -0.25% | -0.01% | 0.13% | -0.07% | -0.13% | 0.17% | 0.04% |
The heat map shows percentage changes of major currencies against each other. The base currency is picked from the left column, while the quote currency is picked from the top row. For example, if you pick the US Dollar from the left column and move along the horizontal line to the Japanese Yen, the percentage change displayed in the box will represent USD (base)/JPY (quote).
Market impulse turns risk-averse amid renewed tensions between the United States (US) and Iran. As of writing, S&P 500 futures trade 0.2% lower around 7,395. The US Dollar Index (DXY), which tracks the Greenback’s value against six major currencies, is 0.25% higher to near 98.15.
A report from CNN showed on late Monday that US President Donald Trump has grown increasingly frustrated with how the Iranians are handling talks to end the conflict, and some Trump aides say that he is now more seriously considering a resumption of major combat operations than he has in recent weeks.
Later in the day, investors will focus on the US Consumer Price Index (CPI) data for April, which will be published at 12:30 GMT. The US CPI report is expected to show that the headline inflation accelerated to 3.7% Year-on-Year (YoY) from 3.3% in March.
In the United Kingdom (UK), investors await the preliminary Q1 Gross Domestic Product (GBP) data, which will be released on Thursday. The data is expected to show that the economy grew at a faster pace of 0.6% against the previous reading of 0.1%.
GBP/USD technical analysis
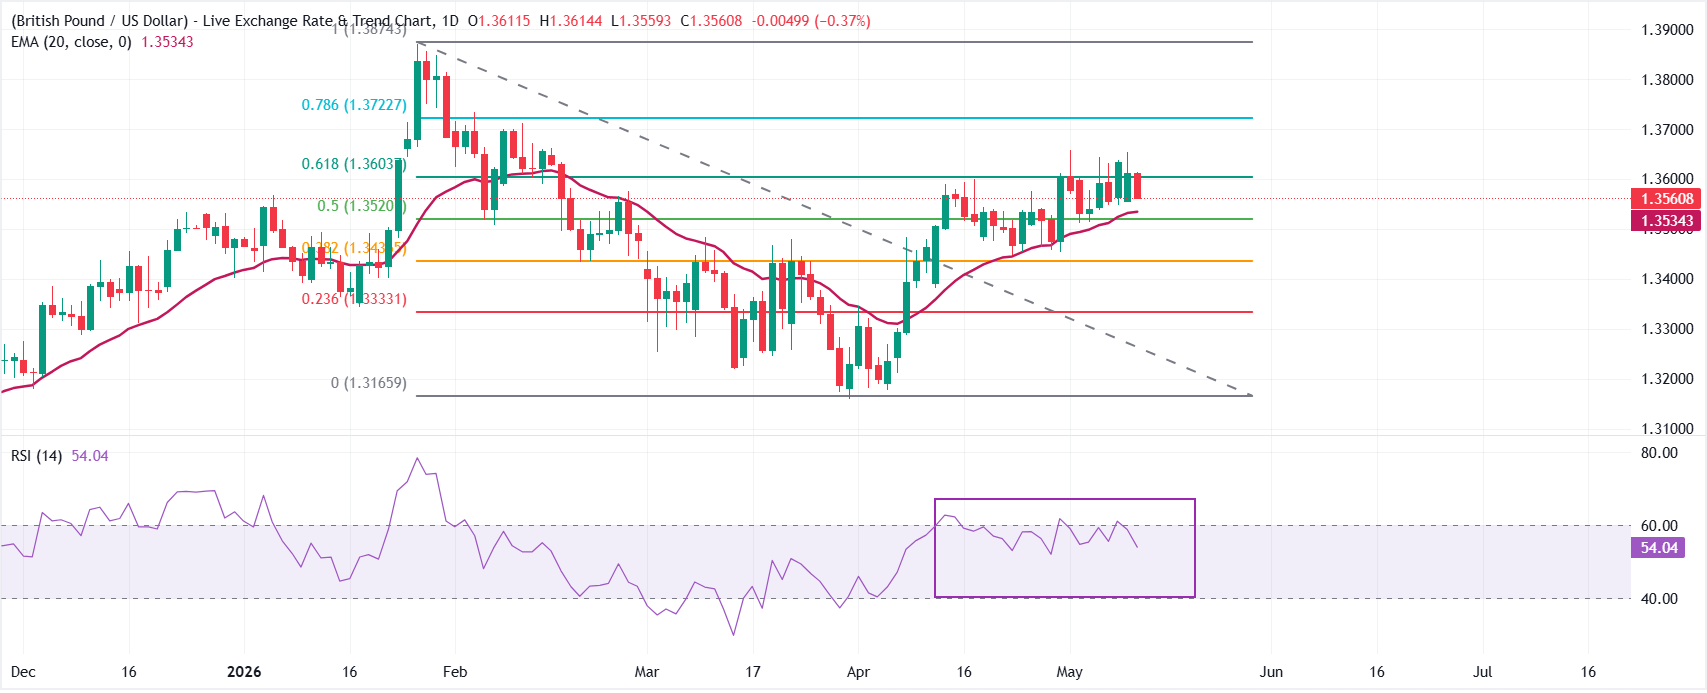
GBP/USD trades lower at 1.3570 in the European trade. However, the pair holds a bullish bias as it stays above the 20-day exponential moving average (EMA) around 1.3534 and the 50% Fibonacci retracement at 1.3520 of the latest downswing.
The Relative Strength Index (RSI) hovers near 54, suggesting mildly positive momentum that could allow buyers to probe higher as long as price holds over these nearby supports.
On the topside, immediate resistance emerges at the 61.8% Fibonacci retracement around 1.3604, with further barriers at the 78.6% level near 1.3723 and the recent swing high zone aligned with the 100% retracement at 1.3874. On the downside, a break back under the 20-day EMA at 1.3534 would expose the 50% retracement at 1.3520, ahead of deeper supports at the 38.2% level near 1.3437 and the 23.6% retracement at 1.3333, while the 0% anchor at 1.3166 remains a more distant structural floor.
(The technical analysis of this story was written with the help of an AI tool.)
Economic Indicator
Gross Domestic Product (QoQ)
The Gross Domestic Product (GDP), released by the Office for National Statistics on a monthly and quarterly basis, is a measure of the total value of all goods and services produced in the UK during a given period. The GDP is considered as the main measure of UK economic activity. The QoQ reading compares economic activity in the reference quarter to the previous quarter. Generally, a rise in this indicator is bullish for the Pound Sterling (GBP), while a low reading is seen as bearish.
Read more.Next release: Thu May 14, 2026 06:00 (Prel)
Frequency: Quarterly
Consensus: 0.6%
Previous: 0.1%
Source: Office for National Statistics
Author

Sagar Dua
FXStreet
Sagar Dua is associated with the financial markets from his college days. Along with pursuing post-graduation in Commerce in 2014, he started his markets training with chart analysis.