|

GBP/USD Price Analysis: Pound pressuring the 1.3172 resistance vs. US dollar

  • GBP/USD is consolidating the bullish breakout above the 1.3100 handle.
  • The level to beat for bulls is the 1.3172 resistance.
 

GBP/USD daily chart 

 
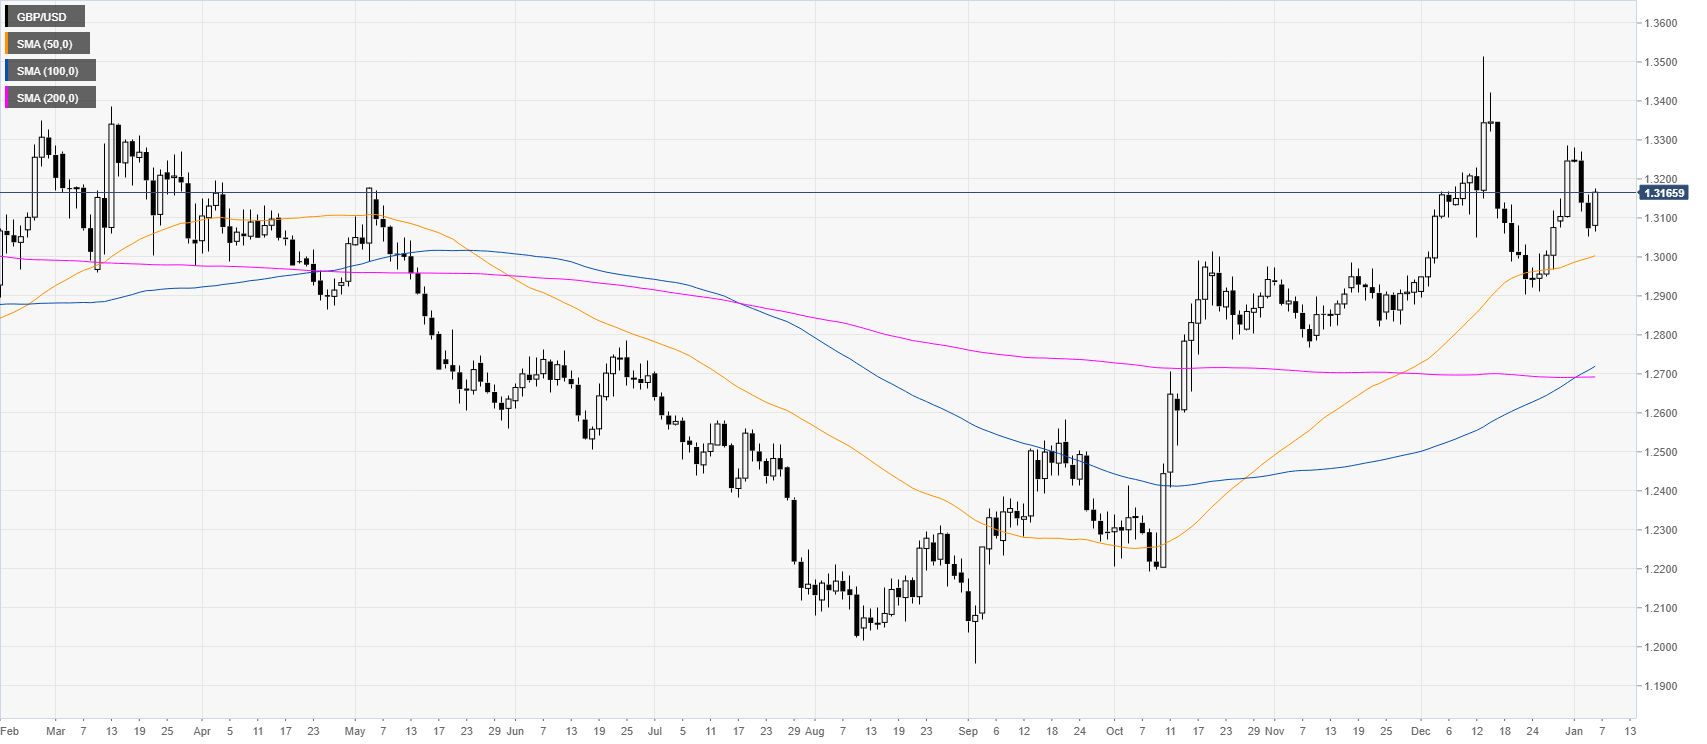
GBP/USD is trading in a bullish channel above the main SMAs. However, the year started with a potential lower high just below the 1.3300 hanlde that bulls will need to overcome. 
   

GBP/USD four-hour chart

 
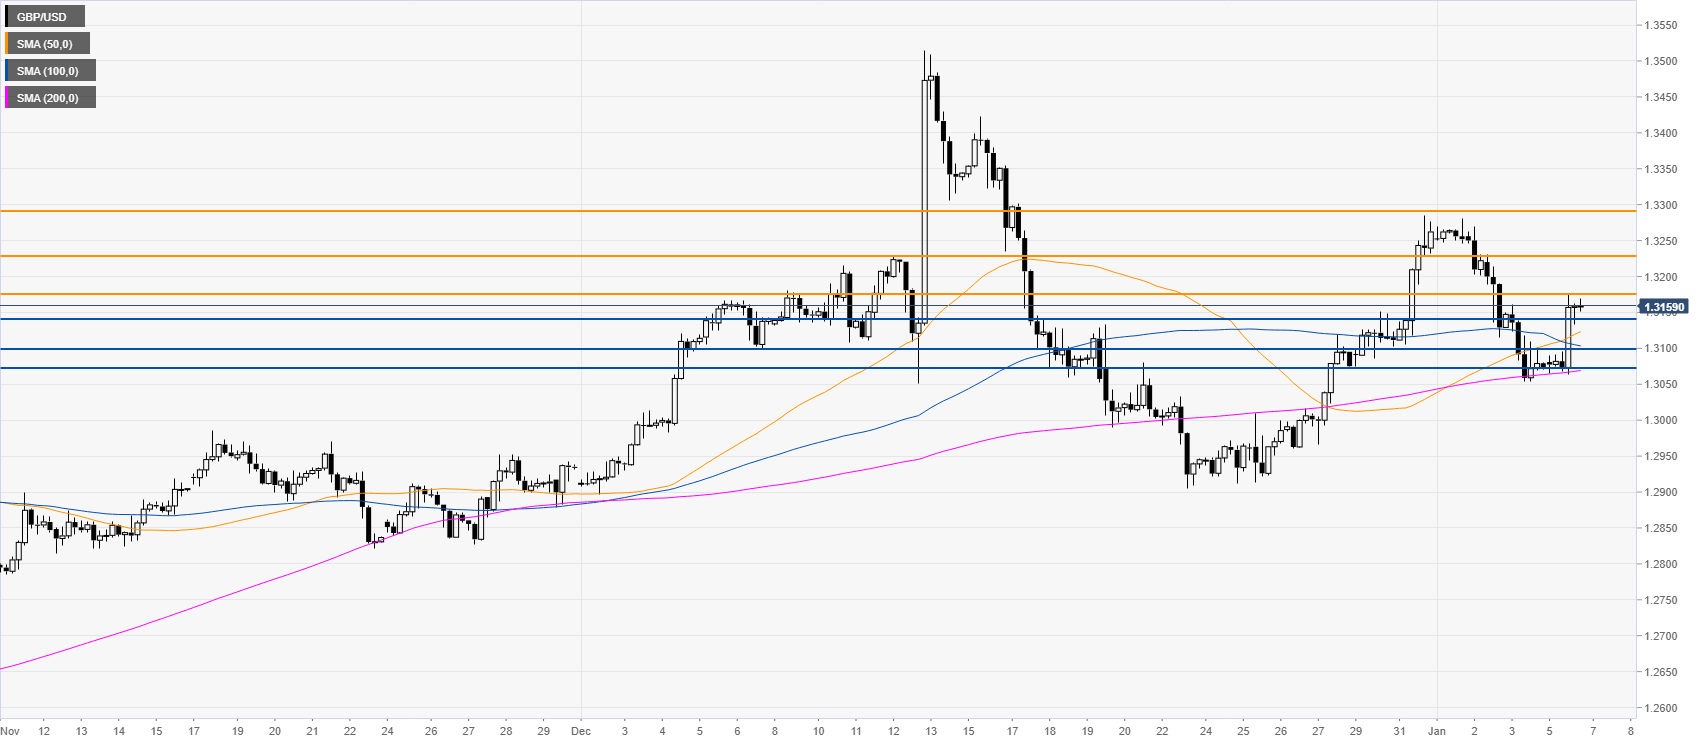
The market is pressuring the 1.3172 resistance level while trading above the main SMAs on the four-hour chart. Buyers want to capitalize on the recent bullish breakout and break the 1.3172 level to drive the quote towards the 1.3227 and 1.3290 levels, according to the Technical Confluences Indicator. On the flip side, bears could take the lead on a break below the 1.3144 level. Further down lie the 1.3100/1.3076 support zone.  
 

Additional key levels

GBP/USD

Overview
Today last price1.3163
Today Daily Change0.0089
Today Daily Change %0.68
Today daily open1.3074
 
Trends
Daily SMA201.3118
Daily SMA501.2997
Daily SMA1001.2709
Daily SMA2001.2692
 
Levels
Previous Daily High1.3161
Previous Daily Low1.3053
Previous Weekly High1.3285
Previous Weekly Low1.3053
Previous Monthly High1.3515
Previous Monthly Low1.2896
Daily Fibonacci 38.2%1.3094
Daily Fibonacci 61.8%1.312
Daily Pivot Point S11.3031
Daily Pivot Point S21.2988
Daily Pivot Point S31.2923
Daily Pivot Point R11.3139
Daily Pivot Point R21.3204
Daily Pivot Point R31.3246

Author

Flavio Tosti

Flavio Tosti

Independent Analyst


More from Flavio Tosti

Share:

Editor's Picks

GBP/USD strengthens to near 1.3400 as UK political risk fades

The GBP/USD pair gathers strength near 1.3395 during the Asian trading hours on Thursday, bolstered by fading domestic political uncertainty. However, hawkish minutes from the Federal Reserve and renewed tensions between the US and Iran might support the US Dollar and cap the upside for the major pair.


EUR/USD sticks to positive bias above 1.1400 vs USD; Mideast tensions cap gains

The EUR/USD pair attracts some buyers for the second straight day, though it lacks follow-through and remains confined within the previous day's range during the Asian session on Thursday. Spot prices currently trade around the 1.1420 area, up less than 0.10% for the day, and remain at the mercy of the US Dollar price dynamics.

Gold sees more pain as Iran tensions revive inflation fears

Gold price reflects signs of softness on Thursday, trading 0.5% lower at around $4,056 during the Asian trading session. The precious metal is under pressure as Middle East hostilities have revived fears of high global inflation, a scenario that discourages major central banks from easing monetary conditions. This framework bodes well for interest-bearing assets, but diminishes the appeal of non-yielding assets, such as Gold.


Bitcoin eyes extension of July rally after reclaiming $60K, but bear market risks remain — CryptoQuant

Bitcoin could be positioned for further gains this month after reclaiming the $60,000 level, as historical July seasonality, improving demand and easing selling pressure point to stronger short-term momentum, according to a Wednesday market report by CryptoQuant. The report noted that July has historically been one of Bitcoin's strongest months, particularly during bear market cycles.

2.50%: Why the Kiwi's first hike in three years is a wager on a number nobody can see
The Reserve Bank of New Zealand (RBNZ) raised the Official Cash Rate (OCR) by 25 basis points to 2.50% at 02:00 GMT on Wednesday, its first hike in three years and the moment the bank that cut deeper than any G10 peer last cycle turned to face the other way.
Bye, forward guidance: How to trade when central banks choose silence

Central banks have spent years telling markets what might come next. Now, traders face the possibility that they say a lot less. From the Federal Reserve to the European Central Bank and the Bank of England, policymakers are pushing back against forward guidance.