GBP/JPY Price Forecast: Yen gains on intervention fears, but uptrend remains intact
- GBP/JPY slips as Yen strengthens on intervention warnings from Japan.
- Elevated Oil prices cap Yen gains, given Japan’s reliance on energy imports
- Technically, GBP/JPY holds above 50-, 100- and 200-day SMAs, keeping the uptrend intact.

The British Pound (GBP) weakens against the Japanese Yen (JPY) on Thursday as the Yen outperforms most of its major peers amid intervention warnings from Japanese authorities, with USD/JPY trading close to the 160.00 level.
At the time of writing, GBP/JPY is trading around 215.27, easing from an intraday high of 215.74.
Japan’s Finance Minister Satsuki Katayama said on Thursday, “Past FX interventions had an influence every time,” adding, “We have a free hand over FX intervention.” She also noted that “our deputies in the US and Japan are in close touch on forex,”
However, the downside in GBP/JPY remains limited as elevated Oil prices linked to supply disruptions in the Strait of Hormuz weigh on the Yen, given Japan’s heavy reliance on imported energy. The strait remains under a dual blockade by the US Navy and Iran, with tensions escalating.
US President Donald Trump said on Truth Social that he has ordered the Navy to “shoot any boat putting mines in Hormuz.” This comes after The Washington Post reported, citing a Pentagon assessment, that clearing mines from the waterway could take up to six months, highlighting the risk of prolonged disruption to global energy supply.
Oil-driven inflation concerns are also complicating the monetary policy outlook for the Bank of England (BoE) and the Bank of Japan (BoJ). Markets are now pricing in the possibility of rate hikes from the BoE, a shift from earlier expectations of rate cuts.
In Japan, elevated energy costs could keep the BoJ on its gradual tightening path, but may slow the pace of normalization, with markets now expecting the central bank to hold rates at its April meeting instead of delivering a hike.
Technical Analysis:
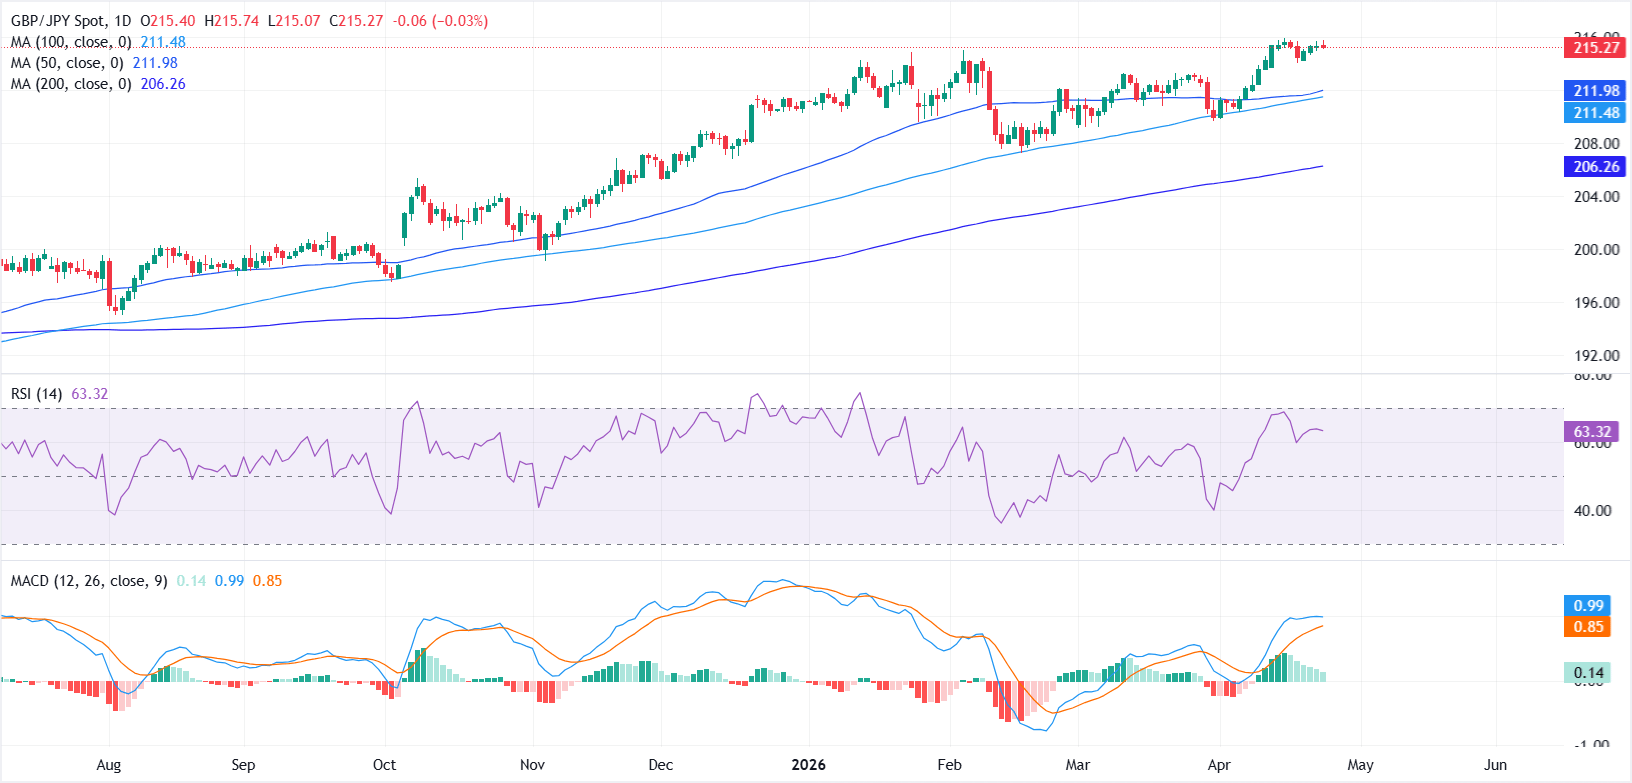
In the daily chart, GBP/JPY retains a bullish near-term bias as price holds well above the 50-day, 100-day and 200-day Simple Moving Averages (SMAs), reinforcing an underlying uptrend despite the latest consolidation near recent highs.
The Relative Strength Index (RSI) at 62 stays in positive territory without being overbought, while the Moving Average Convergence Divergence (MACD) remains in positive ground with the line above zero, both suggesting that upside momentum is still broadly constructive.
On the downside, initial support is seen at 213.50, a former resistance turned support, followed by a closely aligned cluster of the 50-day and 100-day SMAs around 212.00-211.50, while the 200-day SMA at 206.25 marks a deeper but still supportive trend floor.
As long as GBP/JPY holds above these moving-average layers, the technical structure favors dip-buying interest, with only a decisive break below the 50-day SMA likely to signal a more meaningful loss of bullish control.
(The technical analysis of this story was written with the help of an AI tool.)
Japanese Yen Price Today
The table below shows the percentage change of Japanese Yen (JPY) against listed major currencies today. Japanese Yen was the strongest against the New Zealand Dollar.
| USD | EUR | GBP | JPY | CAD | AUD | NZD | CHF | |
|---|---|---|---|---|---|---|---|---|
| USD | 0.11% | 0.05% | 0.02% | 0.07% | 0.20% | 0.51% | 0.17% | |
| EUR | -0.11% | -0.04% | -0.09% | -0.04% | 0.07% | 0.38% | 0.04% | |
| GBP | -0.05% | 0.04% | -0.02% | -0.00% | 0.13% | 0.43% | 0.08% | |
| JPY | -0.02% | 0.09% | 0.02% | 0.04% | 0.18% | 0.44% | 0.14% | |
| CAD | -0.07% | 0.04% | 0.00% | -0.04% | 0.15% | 0.42% | 0.08% | |
| AUD | -0.20% | -0.07% | -0.13% | -0.18% | -0.15% | 0.30% | -0.07% | |
| NZD | -0.51% | -0.38% | -0.43% | -0.44% | -0.42% | -0.30% | -0.35% | |
| CHF | -0.17% | -0.04% | -0.08% | -0.14% | -0.08% | 0.07% | 0.35% |
The heat map shows percentage changes of major currencies against each other. The base currency is picked from the left column, while the quote currency is picked from the top row. For example, if you pick the Japanese Yen from the left column and move along the horizontal line to the US Dollar, the percentage change displayed in the box will represent JPY (base)/USD (quote).
Author

Vishal Chaturvedi
FXStreet
I am a macro-focused research analyst with over four years of experience covering forex and commodities market. I enjoy breaking down complex economic trends and turning them into clear, actionable insights that help traders stay ahead of the curve.


