GBP/JPY Price Forecast: Stalls below 211.50 on haven demand
- GBP/JPY capped below 211.50 despite improving risk sentiment backdrop.
- RSI near neutral suggests momentum remains indecisive in near term.
- Break above 211.50 targets 212.00 and 213.31 resistance levels.

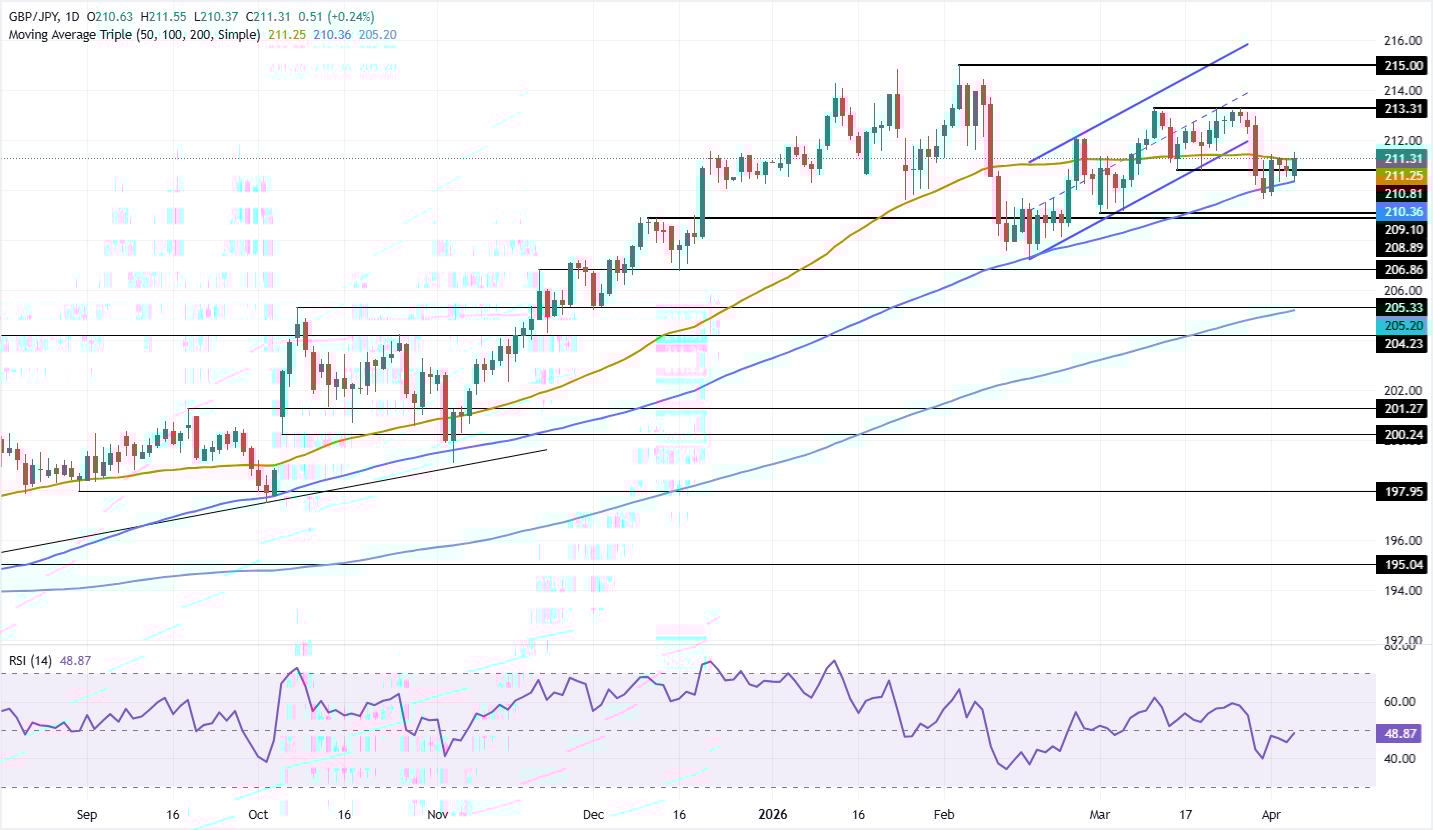
GBP/JPY consolidates above the 211.00 figure yet remains unable to crack key resistance at the 211.50 psychological level due to an improvement in risk appetite, along with the 50-day Simple Moving Average (SMA) at 211.26 acting as a magnet. Fears that Japanese authorities might intervene in the FX market.
GBP/JPY Price Forecast: Technical Outlook
The technical picture shows the GBP/JPY is set to remain sideways unless bulls surpass the 211.50 psychological figure, seen as key resistance before clearing the path to test higher prices. The pair has subsequently tested the previously mentioned level, and a breach of it would pave the way for a challenge of the 20-day SMA at 211.90, ahead of 212.00. On further strength, buyers would target the March 26 high at 213.31, ahead of 214.00.
Conversely, if the pair slips below the 50-day SMA, a test of 211.00 is on the cards. On further weakness, the next support level would be a key trendline at around 210.50-65. A decisive break will expose the 100-day SMA at 210.31.
Momentum-wise, the Relative Strength Index (RSI) reveals that sellers are in charge, but the last two bullish days pushed the RSI near its neutral level.
GBP/JPY Price Chart — Daily
Japanese Yen Price This week
The table below shows the percentage change of Japanese Yen (JPY) against listed major currencies this week. Japanese Yen was the strongest against the New Zealand Dollar.
| USD | EUR | GBP | JPY | CAD | AUD | NZD | CHF | |
|---|---|---|---|---|---|---|---|---|
| USD | -0.01% | 0.07% | -0.02% | -0.01% | 0.00% | 0.03% | -0.02% | |
| EUR | 0.01% | 0.06% | 0.00% | 0.00% | 0.03% | -0.02% | -0.00% | |
| GBP | -0.07% | -0.06% | -0.04% | -0.04% | -0.04% | -0.07% | -0.06% | |
| JPY | 0.02% | 0.00% | 0.04% | -0.00% | 0.02% | 0.07% | 0.04% | |
| CAD | 0.01% | -0.00% | 0.04% | 0.00% | 0.03% | 0.07% | -0.01% | |
| AUD | -0.01% | -0.03% | 0.04% | -0.02% | -0.03% | -0.03% | -0.04% | |
| NZD | -0.03% | 0.02% | 0.07% | -0.07% | -0.07% | 0.03% | 0.05% | |
| CHF | 0.02% | 0.00% | 0.06% | -0.04% | 0.01% | 0.04% | -0.05% |
The heat map shows percentage changes of major currencies against each other. The base currency is picked from the left column, while the quote currency is picked from the top row. For example, if you pick the Japanese Yen from the left column and move along the horizontal line to the US Dollar, the percentage change displayed in the box will represent JPY (base)/USD (quote).
Author

Christian Borjon Valencia
FXStreet
Markets analyst, news editor, and trading instructor with over 14 years of experience across FX, commodities, US equity indices, and global macro markets.