GBP/JPY Price Forecast: Holds 218 floor as bulls eye 219 breakout
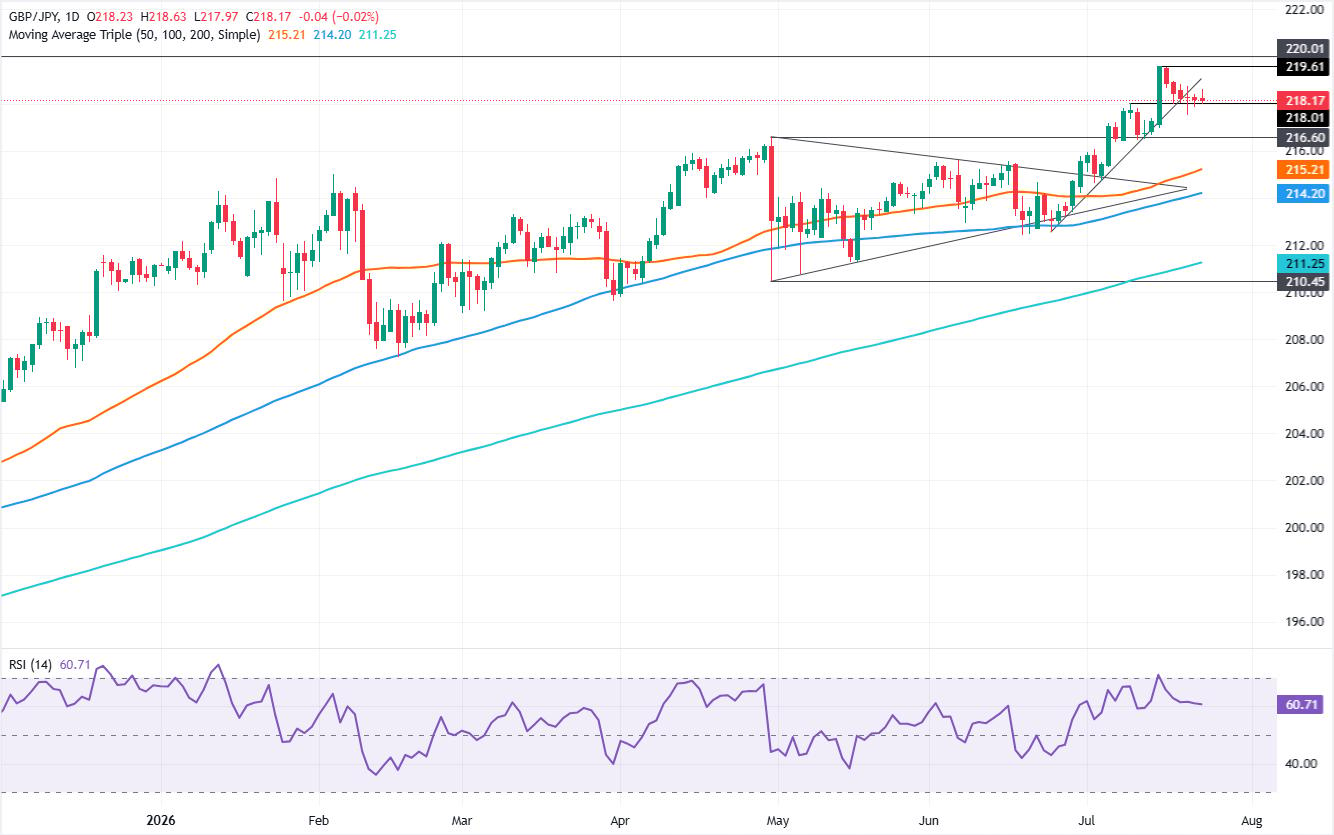
- GBP/JPY holds 218.00 floor despite broken support trendline.
- Bullish harami pattern hints buyers may retest 219.00 resistance.
- Break below 217.53 exposes 216.60 support and deeper pullback.

The GBP/JPY rotates for the third straight day, as a ‘bullish harami’ chart pattern opens the door for further upside, but intervention fears by Japanese authorities cap the cross-pair advance. The GBP/JPY trades at 218.17, unchanged.
GBP/JPY Price Forecast: Technical outlook
The GBP/JPY found its floor at around 218.00, as sellers failed to drive the cross-pair below it, despite breaking a key support trendline three days ago. One reason for sellers’ weakness is speculation that the Bank of England could raise rates, which could favour some upside.
On the other hand, the GBP/JPY has failed to gain traction above 219.00 amid speculation of Japanese Yen intervention to strengthen the Japanese Yen.
For a bullish continuation, the GBP/JPY must clear 219.00 and the year-to-date (YTD) high at 219.61. Once hurdled, the next area of interest would become the 220.00 milestone.
On the flip side, bears must clear the July 21 low of the day (LOD) at 217.53 to challenge 216.60, the April 30 daily high-turned-support.
GBP/JPY Price Chart – Daily
Pound Sterling Price Today
The table below shows the percentage change of British Pound (GBP) against listed major currencies today. British Pound was the strongest against the New Zealand Dollar.
| USD | EUR | GBP | JPY | CAD | AUD | NZD | CHF | |
|---|---|---|---|---|---|---|---|---|
| USD | 0.31% | 0.45% | 0.43% | -0.02% | 0.43% | 0.77% | 0.32% | |
| EUR | -0.31% | 0.15% | 0.15% | -0.34% | 0.12% | 0.48% | 0.00% | |
| GBP | -0.45% | -0.15% | 0.00% | -0.50% | -0.03% | 0.34% | -0.15% | |
| JPY | -0.43% | -0.15% | 0.00% | -0.45% | -0.01% | 0.34% | -0.13% | |
| CAD | 0.02% | 0.34% | 0.50% | 0.45% | 0.44% | 0.80% | 0.33% | |
| AUD | -0.43% | -0.12% | 0.03% | 0.01% | -0.44% | 0.35% | -0.10% | |
| NZD | -0.77% | -0.48% | -0.34% | -0.34% | -0.80% | -0.35% | -0.49% | |
| CHF | -0.32% | -0.00% | 0.15% | 0.13% | -0.33% | 0.10% | 0.49% |
The heat map shows percentage changes of major currencies against each other. The base currency is picked from the left column, while the quote currency is picked from the top row. For example, if you pick the British Pound from the left column and move along the horizontal line to the US Dollar, the percentage change displayed in the box will represent GBP (base)/USD (quote).
Author

Christian Borjon Valencia
FXStreet
Markets analyst, news editor, and trading instructor with over 14 years of experience across FX, commodities, US equity indices, and global macro markets.

















