Friday’s sell-off breaks the extension cycle across Nasdaq, S&P 500 and Dow Futures

Friday’s June 5 sell-off changed the immediate structure across US index futures.
Nasdaq, S&P 500 and Dow Futures had all advanced through clearly defined recovery, rotation and extension phases following the March reversal. The MacroStructure maps tracked those stages before price reached the recent highs, providing a framework for measuring where each index stood within the broader move.
That framework is now entering a different phase.
The MacroStructure framework has tracked the progress of the three major index futures since the March reversal, with each stage of the recovery, rotation and extension regularly documented in the weekly report. The weekly report provides the longer-term map and identifies the major structural levels likely to guide the coming sessions and weeks.
The Daily Futures Desk Report is released during the London mid-session to prepare traders for the US cash-market open and the main New York trading window. It provides a deeper view of the intraday map and structure within the longer-term framework, including TPO and Market Profile development, value, Volume POC, VWAP, cumulative delta, session positioning and real-time acceptance or rejection around the predefined levels.
The market is no longer trading through a clean continuation environment. Friday’s decline pushed the three major index futures away from completed or nearly completed upside structures and back toward important weekly support.
The next several sessions should help determine whether the decline develops into a controlled repair, a deeper retracement through the previous extension phases or a broader correction across US equities.
The objective is not to predict the exact low. The more useful task is to identify where buyers need to respond, where sellers may retain control and which levels would confirm that the structure is beginning to improve.
The warning developed before Friday’s sell-off
The early warning was visible across all three indexes.
Price continued to push higher in the final stages of the respective recovery structures, while the momentum indicators stopped confirming the advance. In each case, price was making further progress while momentum was flattening or moving lower.
That divergence did not provide the exact timing of the reversal, but it showed that the final push was losing quality.
Nasdaq displayed the clearest version of the warning during the second extension. The S&P 500 showed a similar loss of momentum near the completion of its extension, while Dow Futures stalled after completing a full rotation toward the upper section of the map.
Friday’s session exposed that weakness.
One trading session does not define the entire medium-term outcome, but the size and speed of the reversal confirmed that the market had moved beyond a routine continuation phase.
Nasdaq Futures — Second extension overshoot returns to major support
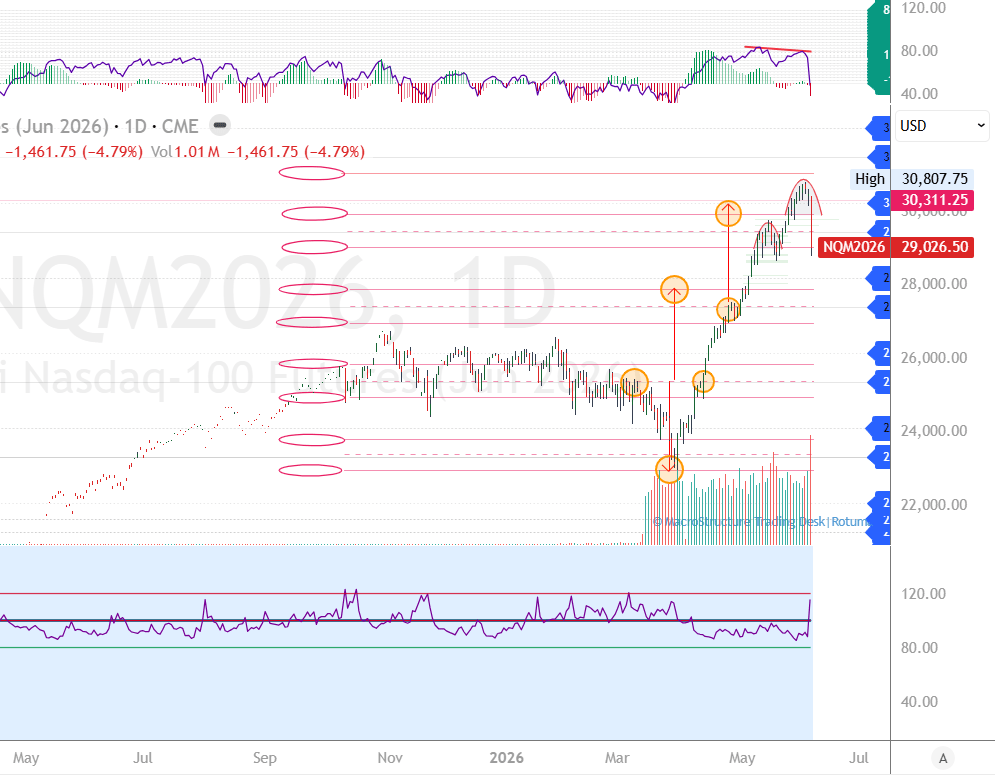
Nasdaq Futures completed a recovery phase followed by two separate extension phases after the March reversal.
The second extension carried price toward the recent high near 30,807.75. However, the structure had already begun showing warning signs around the middle of that extension.
Price pulled back and then pushed higher, while the momentum indicator moved in the opposite direction. The resulting divergence suggested that the market was becoming increasingly stretched.
Friday’s decline converted that warning into a clear structural event.
NQ closed near 29,026, leaving price directly above major weekly support around 29,019.
The current Nasdaq condition is best described as an overshoot following completion of the second extension, followed by an aggressive pullback into support.
Holding 29,019
Holding above 29,019 would keep the first repair path open.
Buyers would need to stabilise the market, rebuild value above the level, and begin repairing the damage caused by Friday’s decline.
The first recovery objective sits around 29,456.
That level should initially be treated as a repair target rather than confirmation that the broader advance has resumed. Friday’s decline created meaningful overhead supply, and the first rebound may face sellers reducing exposure into strength.
A more credible repair would require NQ to reclaim 29,456, hold above that level and begin rebuilding acceptance through the lower part of the second-extension structure.
Failure to hold 29,019
Failure to hold above 29,019 would keep the correction active and expose the beginning of the second extension.
A brief move below support would not automatically confirm structural failure. The stronger bearish signal would be sustained acceptance below 29,019, lower-value development, and repeated failures to reclaim the level.
That sequence would suggest that the final extension had been rejected and that Nasdaq Futures were rotating back through a larger portion of the previous advance.
Nasdaq bottom line
Above 29,019, the market retains a path of repair toward 29,456.
Above 29,456, the repair gains credibility, but further acceptance would still be required before treating the move as renewed expansion.
Below 29,019, the beginning of the second extension becomes the next major structural test.
S&P 500 Futures — The 7,423–7,319 band controls the next phase
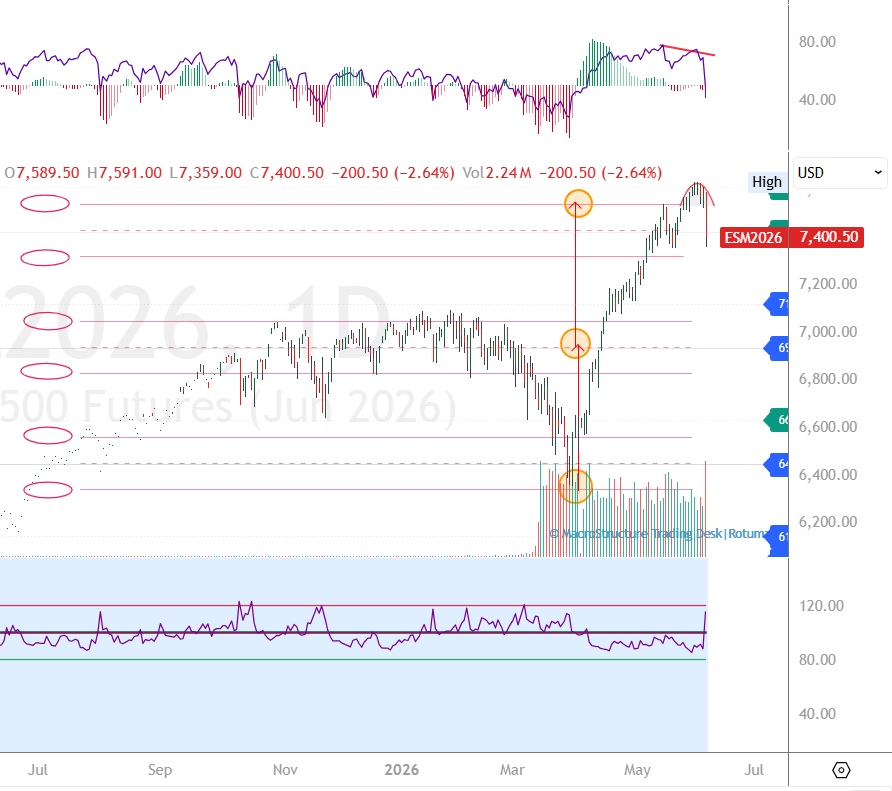
S&P 500 Futures followed a similar recovery path after the March reversal, although ES completed one main extension phase rather than the two extensions visible in Nasdaq.
Price advanced toward the upper section of the MacroStructure map, but momentum began weakening as the index approached the final stage of the move.
The divergence was similar to Nasdaq. Price continued pressing higher while the momentum indicator moved lower, warning that the final advance was losing strength.
Friday’s decline pushed ES back into a critical weekly price band between 7,423 and 7,319.
The index closed near the middle of that zone.
This band now represents the main decision area for the next stage of the S&P 500 structure.
Reclaiming 7,423
Reclaiming and holding above 7,423 would be the first constructive signal.
A brief move above the level would not be enough on its own. Buyers would need to establish acceptance above 7,423, rebuild value on the upper side of the band and begin working through the supply created during Friday’s sell-off.
If that process develops, ES could begin repairing toward the extension-completion area.
That move would represent structural repair rather than an immediate return to expansion. The market would still need to prove that the previous upper structure can be reclaimed and held.
Losing 7,319
Failure to hold above 7,319 would weaken the repair argument and expose the beginning of the extension phase.
That lower structure matters because it marks the area from which the latest major advance developed.
An acceptance below 7,319 would indicate that the market is no longer simply correcting from the upper extension. It would suggest that ES is retracing a larger portion of the recovery structure.
The more important confirmation would be lower-value development, failed attempts to reclaim 7,319 and continued expansion in downside volume.
S&P 500 bottom line
Inside 7,423–7,319, the market remains within a major weekly decision band.
Above 7,423, the first repair path opens toward the extension-completion area.
Below 7,319, the extension's beginning becomes the next major support focus.
Dow Futures — Full rotation completes before the pullback
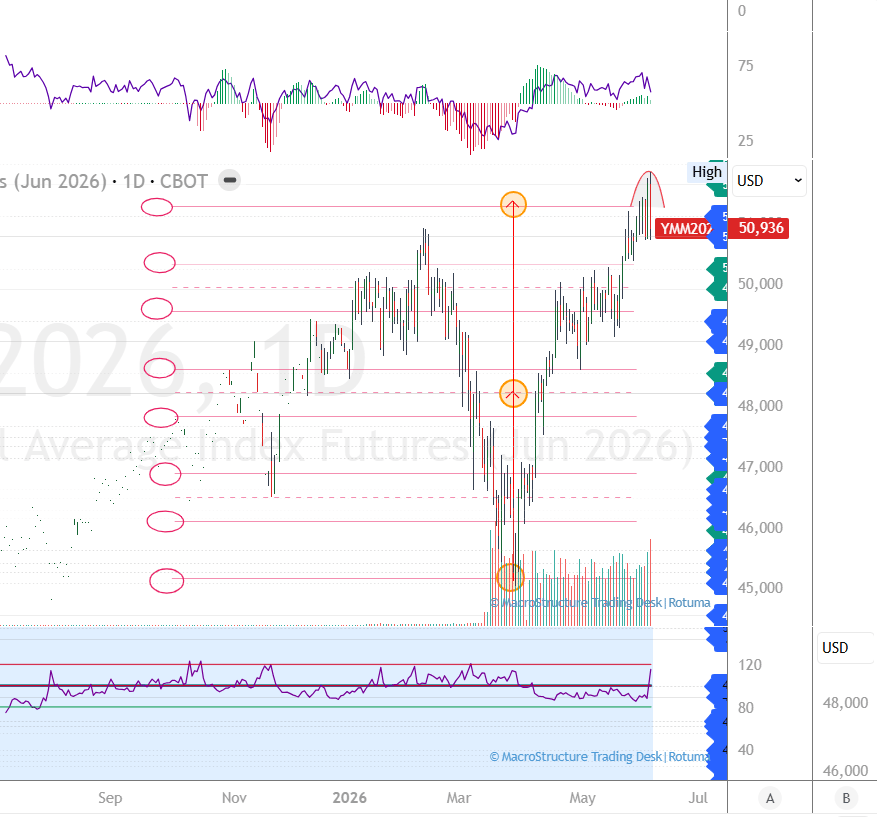
Dow Futures entered Friday’s decline from a somewhat stronger structural position.
YM moved through several stages of recovery after the March reversal, reclaimed its central pivot and completed a full rotation toward 51,293.
Price briefly overlapped that upper objective before pulling back.
The early warning remained consistent with Nasdaq and the S&P 500. During the final stage of the rotation, price continued pressing higher while momentum stalled.
That divergence indicated that the advance was becoming less efficient as YM approached the map's upper boundary.
Friday’s decline brought Dow Futures back toward major support around 50,800, an area that also aligns with the February highs.
The index tagged that level before closing near 50,936.
Holding 50,800
Holding above 50,800 would suggest that the completed rotation is undergoing a controlled pullback rather than a broader structural failure.
The first repair objective sits around 51,206.
A recovery above 51,206 would improve the short-term structure and place the completed rotation area near 51,293 back into focus.
Buyers would still need to establish acceptance above 51,206 before treating the move as a renewed challenge of the highs.
Failure to hold 50,800
Failure to hold above 50,800 would weaken the immediate repair case and shift the next focus for support toward 50,431.
Acceptance below 50,431 would indicate that the pullback is developing into a deeper retracement of the previous recovery.
Dow bottom line
Above 50,800, YM retains a repair path toward 51,206.
Above 51,206, the completed rotation zone near 51,293 returns to focus.
Below 50,800, pressure shifts toward 50,431.
Treasury yields remain a major headwind
The bond-yield structure adds an important layer to the index-futures outlook.
The 30-year, 10-year and 2-year Treasury yields completed their previously defined upside targets during the earlier advance. They then pulled back from those targets and are currently holding their major support levels.
That sequence matters.
The targets were completed during the previous yield move, not during Friday’s index-futures sell-off. The subsequent pullback brought yields back toward support, but none of the three maturities has yet broken its main structural level.
As long as those supports remain intact, the previous upside targets remain available for another test.
30-year treasury yield
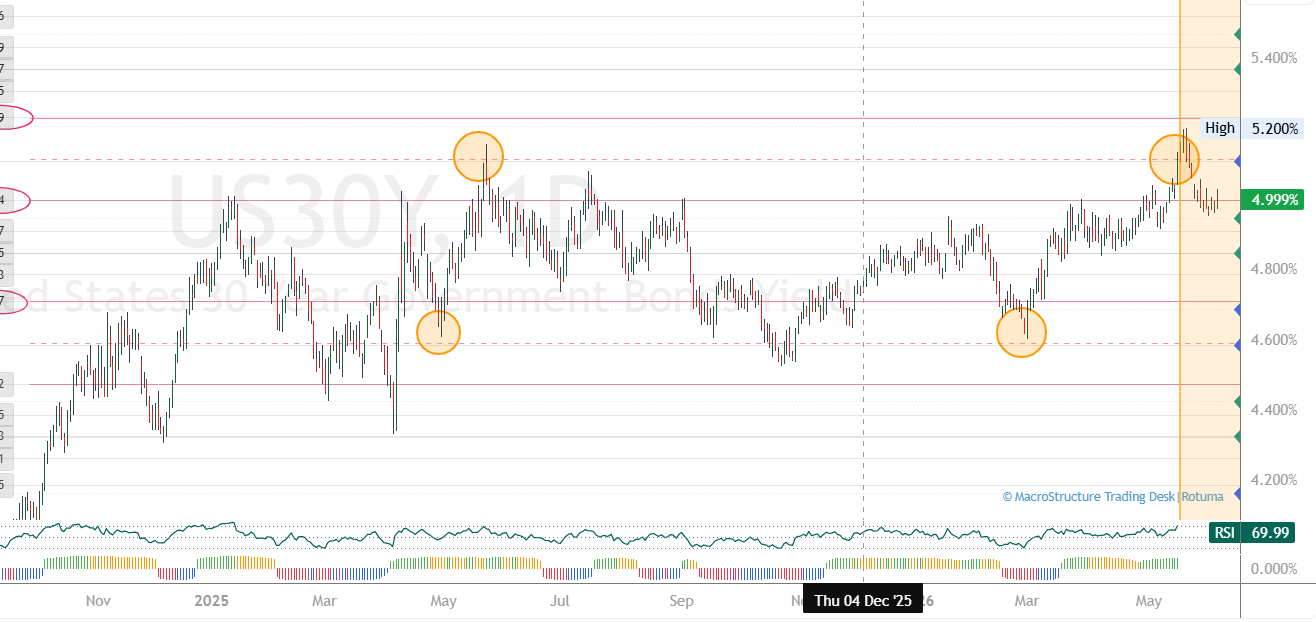
Critical support: 4.994%
Previous targets: 5.106% and 5.200%
Current state: Holding above critical support
The 30-year yield previously advanced from 4.994%, reached 5.106% and extended toward 5.200% before pulling back.
Remaining above 4.994% keeps the long-end structure constructive and leaves both previous targets open for another visit.
A renewed move toward 5.106% or 5.200% would maintain pressure on equity valuations, financing conditions and the broader index-futures repair process.
10-year treasury yield
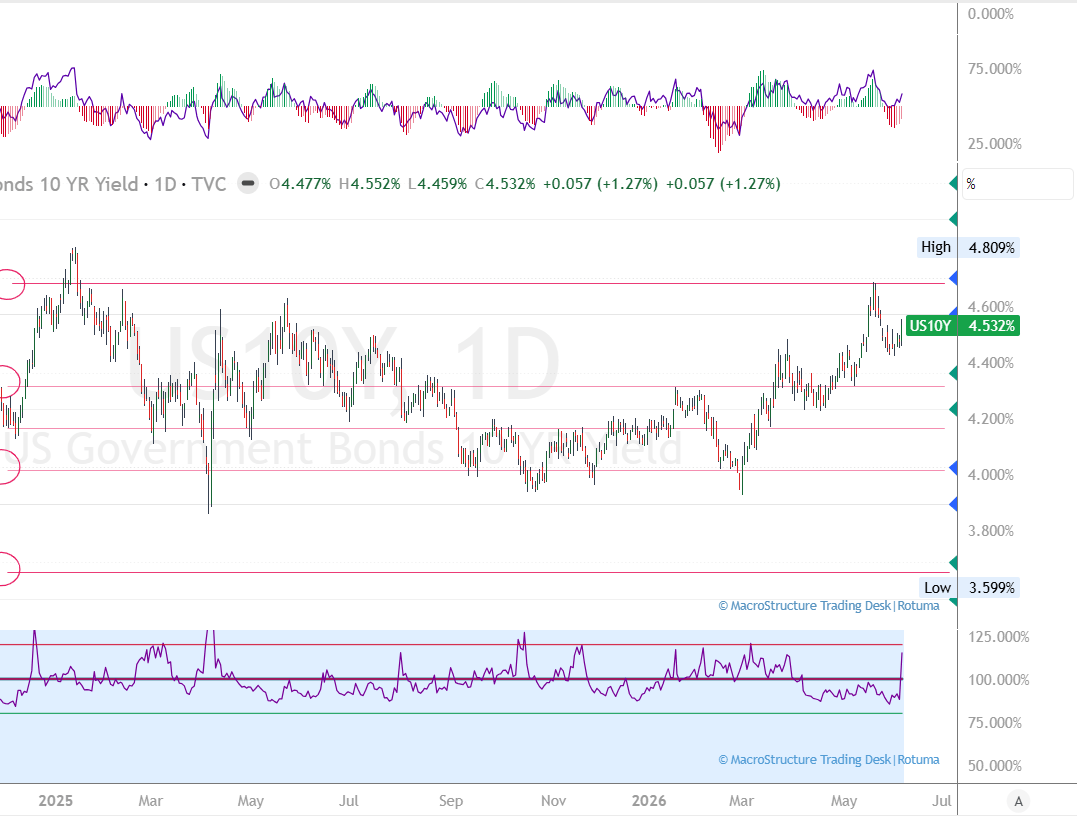
Critical support: 4.491%
Previous targets: 4.569% and 4.680%
Current state: Holding above critical support
The 10-year yield previously held at 4.491%, advanced to 4.569%, and completed the move toward 4.680% before rotating lower.
The current pullback has not broken the main support structure.
Remaining above 4.491% keeps 4.569% and 4.680% in play as potential revisit levels.
This remains especially important for Nasdaq Futures because technology and other long-duration growth assets are particularly sensitive to changes in the 10-year yield.
2-year treasury yield
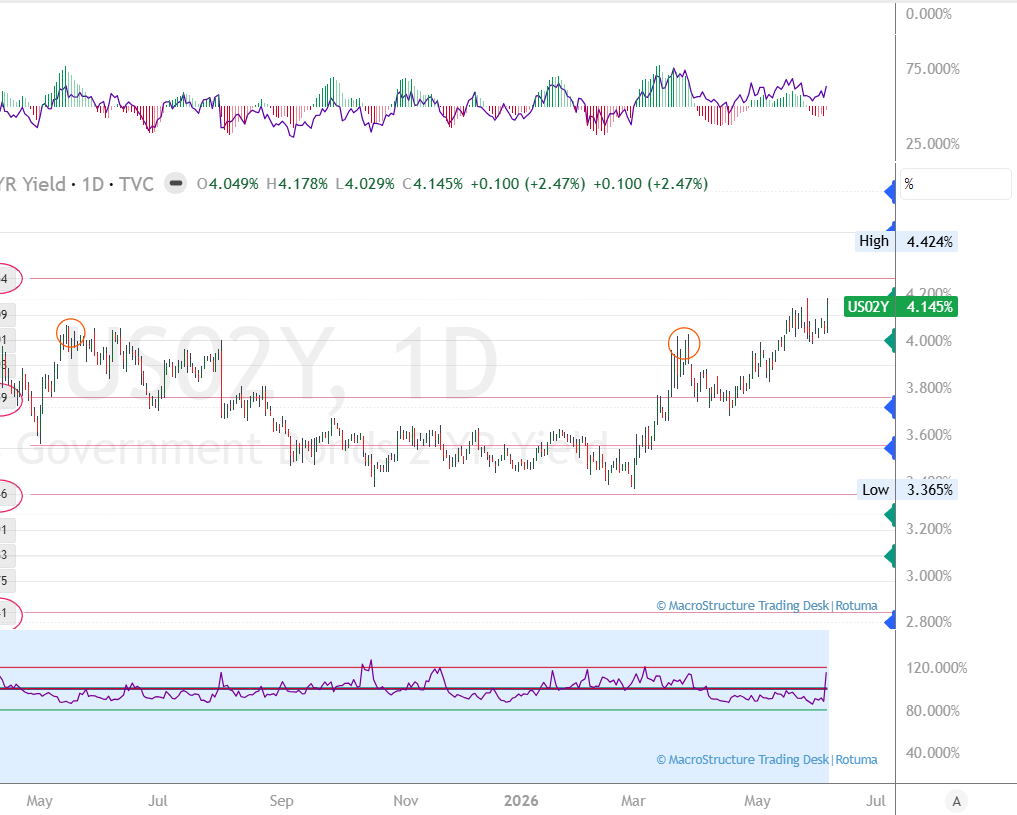
Critical support: 4.000%
Previous target: 4.176%
Current state: Holding above critical support
The 2-year yield previously advanced from 4.000% and reached 4.176% before pulling back.
Holding above 4.000% keeps the front-end structure intact and leaves 4.176% available for another test.
That suggests restrictive policy expectations remain embedded in the market rather than easing materially.
The rates–equities relationship
The current cross-asset structure is reasonably clear.
All three Treasury yields are holding major support after completing their previous upside targets.
That does not guarantee another rise in yields, but it keeps the pressure active.
A renewed move toward the previous targets would create a more difficult environment for index-futures repair:
- Nasdaq would remain highly exposed to renewed strength in the 10-year yield.
- The S&P 500 would face broader valuation pressure from the 10-year and 30-year yields.
- Dow Futures may continue showing relative resilience, but a coordinated rise across the yield curve would still tighten financial conditions and limit the quality of any recovery.
A rebound in NQ, ES, and YM, while yields remain above support, may initially represent technical repair rather than a fully confirmed recovery.
A stronger equity repair would carry more credibility if yields begin losing their support structures at the same time.
What could drive the next several weeks
The coming weeks contain several events that could influence Treasury yields, Federal Reserve expectations, and the repair process across US index futures.
Inflation data
The May Consumer Price Index is due on June 10, followed by the Producer Price Index on June 11.
These releases arrive at an important point for the rates market. All three Treasury maturities are holding their major support structures, leaving their previous upside targets open for another test.
A hotter inflation reading could reinforce the current yield structure and increase the probability of another move toward those previous targets. That would likely place renewed pressure on Nasdaq and make the repair process more difficult across the broader index-futures complex.
Softer inflation could allow yields to lose momentum and give NQ, ES and YM more room to stabilise. Even then, index buyers would need to reclaim their respective decision levels before the repair could be considered structurally confirmed.
Federal Reserve meeting
The Federal Reserve’s June 16–17 meeting will be another major point of focus.
The meeting includes updated economic projections, making the Fed’s assessment of inflation, growth, employment and the expected policy path particularly important.
The market reaction may depend less on the immediate policy decision and more on how policymakers describe the balance between persistent inflation and any signs of slowing economic activity.
A more restrictive policy message could support the 2-year yield above 4.000% and reinforce pressure across the rest of the yield curve.
A less restrictive message could reduce some of that pressure, but the equity response would still need confirmation through acceptance above the predefined NQ, ES and YM repair levels.
Retail sales and consumer demand
Retail-sales data are scheduled alongside the Fed decision on June 17.
The consumer remains an important part of the broader growth picture. Strong spending could support the economic outlook but may also keep inflation and yields elevated.
Weak spending could reduce rate pressure, although a material slowdown may pose a different concern for equity markets by lowering growth and earnings expectations.
The reaction across yields and index futures will be more informative than the headline figure alone.
Treasury-yield support
The yield levels themselves remain one of the clearest drivers of the next phase.
As long as the 30-year holds 4.994%, the 10-year holds 4.491%, and the 2-year holds 4.000%, the rates market retains a constructive structure.
Another rotation toward the previous yield targets would keep pressure on index-futures valuations.
Failure below those critical supports would begin changing the cross-asset picture and could provide a more favourable backdrop for equity repair.
Personal consumption expenditures inflation
The next Personal Income and Outlays report, including the Federal Reserve’s preferred PCE inflation measures, is scheduled for June 25.
That release will provide another view of inflation and consumer activity after the CPI, PPI and Federal Reserve meeting.
Persistent inflation would keep the higher-yield risk active. Evidence that price pressure is easing could support a more durable equity recovery, provided that the major index futures have also begun to reclaim their structural levels.
Technology and semiconductor participation
Nasdaq’s recovery will depend heavily on participation from semiconductor companies and the largest technology companies.
A rebound driven by only a small number of names would carry less conviction than a move supported by broader participation, improving breadth and strengthening volume.
Weak semiconductor participation would make it difficult for NQ to build sustained acceptance above 29,456, even if the index initially rebounds from 29,019.
Cross-index confirmation
The strongest constructive signal would come from all three index futures repairing together.
NQ holding 29,019 while ES reclaims 7,423 and YM defends 50,800 would suggest that Friday’s selling pressure is being absorbed across the broader market.
A divided response would require more caution.
Dow holding support while Nasdaq continues lower could point toward a concentrated technology and growth correction. A simultaneous loss of major support across NQ, ES and YM would indicate that the weakness is becoming more broadly established.
Cross-index read
The three indexes are entering the next phase from different structural positions.
Nasdaq Futures experienced the most serious immediate damage after overshooting the second extension.
S&P 500 Futures closed inside a broad weekly decision band.
Dow Futures completed their full rotation and pulled back toward support aligned with the February highs.
That difference may help reveal whether the current correction remains concentrated in technology and growth or spreads more broadly across the market.
If Dow holds 50,800 while Nasdaq and the S&P 500 remain under pressure, the market may be experiencing a more concentrated, growth-led correction.
If YM loses 50,800 and then 50,431 while NQ and ES also break their major supports, the weakness would carry broader significance.
The strongest repair signal would come from all three indexes reclaiming their respective levels together:
- NQ holding 29,019 and repairing toward 29,456.
- ES reclaiming 7,423.
- YM holding 50,800 and recovering toward 51,206.
That alignment would suggest that Friday’s decline is being absorbed across the broader market rather than repaired by a single index.
What to watch during the repair
The first rebound will be important, but price alone will not be enough.
A more credible recovery should include improved value development, higher-volume POCs, a stronger cumulative delta, lower volatility, and broader participation across sectors.
The rates market should remain central to the read.
If Treasury yields rotate back toward their previous targets while index futures struggle to reclaim support, the correction is likely to remain active.
If yields begin to lose their major supports while NQ, ES, and YM reclaim their decision levels, the repair process would have stronger cross-market confirmation.
Market breadth will also matter.
A recovery led by only a small group of large-cap stocks would be less convincing than one supported by broader sector participation.
Weekly structure and daily execution
The weekly map defines the larger structural battlefield.
For Nasdaq Futures, the main focus is 29,019, with a repair path toward 29,456.
For S&P 500 Futures, the 7,423–7,319 band controls the next phase.
For Dow Futures, 50,800 is the first support test, with 51,206 controlling the initial repair and 50,431 protecting against a deeper retracement.
The Daily Futures Desk Report will provide the deeper intraday view for short-term traders.
Released during the London mid-session, the daily report prepares traders for the US cash-market open and the main New York trading window. It tracks the Asia-to-London transition, session positioning, TPO and Market Profile development, value area, Volume POC, VWAP, cumulative delta and real-time acceptance or rejection around the weekly map.
The weekly report provides the higher-timeframe framework. The daily report provides the deeper structure and execution detail.
Final read
Friday’s decline did not appear without warning.
Nasdaq, S&P 500 and Dow Futures were all showing momentum divergence near the final stages of their respective recovery structures.
Price continued to advance, but the underlying momentum behind those advances had begun to weaken.
Friday’s session exposed that imbalance and forced all three indexes back toward important support.
Nasdaq is testing 29,019 after completing two extension phases.
The S&P 500 is trading inside the 7,423–7,319 weekly decision band.
Dow Futures are testing 50,800 after completing a full rotation toward 51,293.
At the same time, the 30-year, 10-year and 2-year Treasury yields are holding major support after completing their previous upside targets.
That keeps the possibility of another yield advance open and leaves pressure on equity-index buyers.
The broader recovery structures have been damaged, but the next outcome has not yet been confirmed.
The coming weeks should be judged through price response, acceptance, value development, momentum, volume and the interaction between index futures and Treasury yields.
There is no need to decide the full outcome before the market provides that information.
Structure defines context; price reveals the outcome.
Author

Denis Joeli Fatiaki
Independent Analyst
Denis Joeli Fatiaki possesses over a decade of extensive experience as a multi-asset trader and Market Strategist.


