Few Stocks are holding the S&P up: Is that a warning? [Video]
![Few Stocks are holding the S&P up: Is that a warning? [Video]](https://editorial.fxsstatic.com/images/i/Tech_1.png)
The S&P is holding near its highs. On the surface, the market looks strong. But look underneath the index and the story changes: most of the stocks in the S&P 500 are negative this year. What's carrying the index is a handful of large-cap technology names. And when a market depends on so few names, any stumble in that group is felt across the whole index.
In short: on the ES, price is stalling below 7,900, and an alternative count — a bearish flat extending Wave 2 — is gaining weight, with a break below 7,835 as the trigger. On EUR/USD, a strong dollar has pushed price into an accumulation zone after an ending diagonal, setting up a bounce toward 1.1300. On oil, the bias remains bullish: break 95 and head back toward 100.
ES: sideways, with a warning from Asia
The S&P futures are building sideways price action and having trouble breaking the 7,900 area. A sideways market on its own doesn't say much. Combined with two other facts, it does. The first is the narrow breadth described above. The second is what happened overnight: the Korean and Japanese stock markets — both heavy in technology — sold off aggressively. If the group holding the index shows weakness in other markets, caution is mandatory.
That's why the alternative count is gaining weight. Instead of treating Wave 2 as complete, we're considering a bearish flat (A-B-C) that extends the correction. We're short, looking for price to break below the 7,835 area and then watching for further downside. One clear risk: tomorrow's CPI report can move the market hard in either direction.
EUR/USD: the end of the decline is near
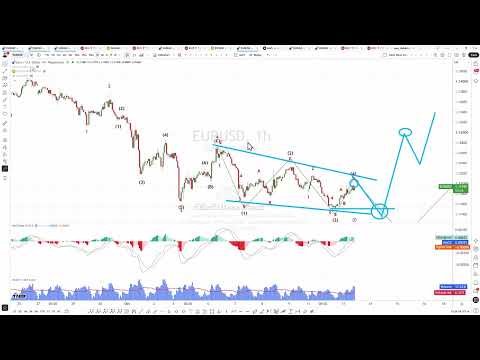
The dollar has strengthened because the bond market has been selling off and yields have been climbing — which will also slow the economy. That pushed EUR/USD lower, into what now looks like an accumulation area.
The structure points to an ending diagonal. The plan: look for sells to complete Wave 4 and a fresh low for Wave 5. After that low, the bigger-picture scenario is a significant bounce toward 1.1300 and possibly higher — potentially the bottom of the market. Until that low completes, the short-term setup remains the leg down.
Oil: the bullish bias holds
With the Middle East crisis still active, oil has built a bullish five-wave sequence. We're now looking for a three-wave B correction, then a bullish continuation to break 95 and likely return to the 100 area.
What the video didn't cover
What market breadth is and why it matters
Breadth measures how many stocks participate in an index move. A healthy bull market rises with most of its components. A fragile one rises because a few large names offset the decline of nearly everything else.
The reason is mechanical. The S&P 500 is cap-weighted: the largest companies carry far more weight than the smaller ones. If five or ten mega-caps rally hard, they can hold the index up while hundreds of stocks fall. The index says "strong"; the underlying market says "weak."
Narrow breadth doesn't guarantee a decline, but it does increase vulnerability. The index becomes exposed to whatever happens to a small group of stocks. If that group corrects, there's no broad base left to cushion the blow.
How it connects to Elliott Wave
This fundamental read is what justifies giving more weight to the alternative count. Elliott Wave doesn't tell you which scenario will happen; it tells you which ones are possible. Context — breadth, the signal from Asia, the CPI print — helps you decide which to prioritize.
A flat that extends Wave 2 fits a market that's tiring without yet having the force for an impulsive decline. If price breaks the reference low with conviction, the flat is confirmed. If price absorbs the selling and reclaims the highs, the primary count of a completed Wave 2 takes back control. That's why you trade with clear invalidation levels, not certainty.
The core idea
An index at highs doesn't always mean a strong market. When a few stocks are carrying the S&P, the structure is fragile — and that fragility shifts the weight between Elliott Wave scenarios. Today the bias is bearish on the ES, accumulation on the euro, and bullish on oil, with tomorrow's CPI as the key risk.
What's your view? Do you see narrow breadth as a risk? Leave it in the comments on the video.
Author

Juan Maldonado
Elliott Wave Street
Juan Maldonado has a University degree in Finance, and Foreign trade started his trading career in 2008. Since 2010 has been analyzing the markets using Elliott Wave with different strategies to spot high probability trades.

















