Factories hold their ground as stocks coil for a break

Today brings the June ISM Manufacturing print, and the setup is more interesting than a single headline number suggests.
Last month the index sat at 54.0, its firmest reading since May 2022 and a sixth straight month in expansion. Our own work lands us at 53.5 for June, a shade below the 53.8 the street is looking for, so call it broadly in line with a modest step down rather than a break in the trend. The reason we lean slightly soft is the regional Fed surveys, which mostly cooled through June. New York dropped hard and Richmond gave back most of May’s jump, with the new orders line easing in both. Set against that, Kansas City ripped to a four-year high and S&P Global’s flash reading pushed to its best level since 2022, so the leading signals are genuinely pulling in opposite directions this month. We split the difference and stay in expansion.
What keeps us constructive under the hood is the relationship between demand and stock. Strip the survey back to its most forward-looking pair, new orders against inventories, and the picture has been firmly positive all year.
That spread turned sharply positive in January and has held between five and seven points every month since. A positive gap means orders are landing faster than warehouses are filling, and that combination usually pulls production higher in the months that follow rather than signalling a stall. It is the main reason we are comfortable forecasting a soft-but-still-expanding number rather than anything approaching contraction.
The one line we would watch more closely than the headline is prices. Every regional survey in June flagged rising input costs, several at multi-year highs, and the panel commentary keeps returning to fuel, tariffs and Middle East supply friction. A hot prices component would reinforce the sticky-inflation story that is keeping the Fed on hold, and that matters more for rates than whether the growth headline prints 53.5 or 54.
The equity read
Which brings us to where the manufacturing story meets the tape. The S&P 500 has spent the back half of June coiling into a tightening triangle, marked in red on the chart below, with price compressing between a descending upper line off the early-June high and a rising lower line built through the mid-month lows.
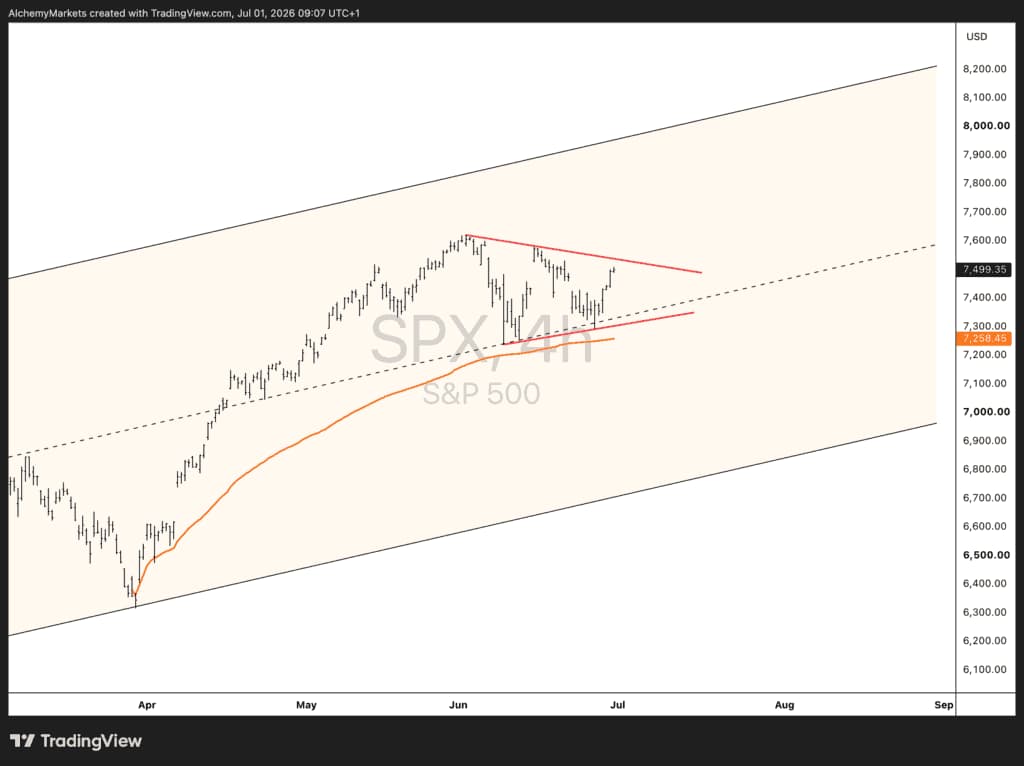
Price is now pressing back toward the upper boundary around 7,500, holding comfortably above its rising average near 7,257. Triangles that form after a strong advance, and this one sits on top of the powerful April-to-June rally, often resolve in the direction of that prior trend. If buyers can force a clean break of the upper line, the measured move projects an objective up toward the 8,000 region, a level that would have sounded ambitious a couple of months ago and now sits within one decisive thrust.
A firm-but-not-hot ISM would fit that story neatly. It keeps the expansion intact, keeps the soft-landing narrative alive, and gives the index a reason to press the upper rail rather than fold back into the range. Watch the triangle boundary and the reaction to the prices component. Those two together will tell you more about the next move than the headline diffusion number itself.
Author

Zorrays Junaid
Alchemy Markets
Zorrays Junaid has extensive combined experience in the financial markets as a portfolio manager and trading coach. More recently, he is an Analyst with Alchemy Markets, and has contributed to DailyFX and Elliott Wave Forecast in the past.


