Exxon Mobil Inc.(XOM) Elliott Wave technical analysis [Video]
![Exxon Mobil Inc.(XOM) Elliott Wave technical analysis [Video]](https://editorial.fxstreet.com/images/TechnicalAnalysis/ChartPatterns/PointFigure/hand-drawing-stock-chart-63151915.jpg)
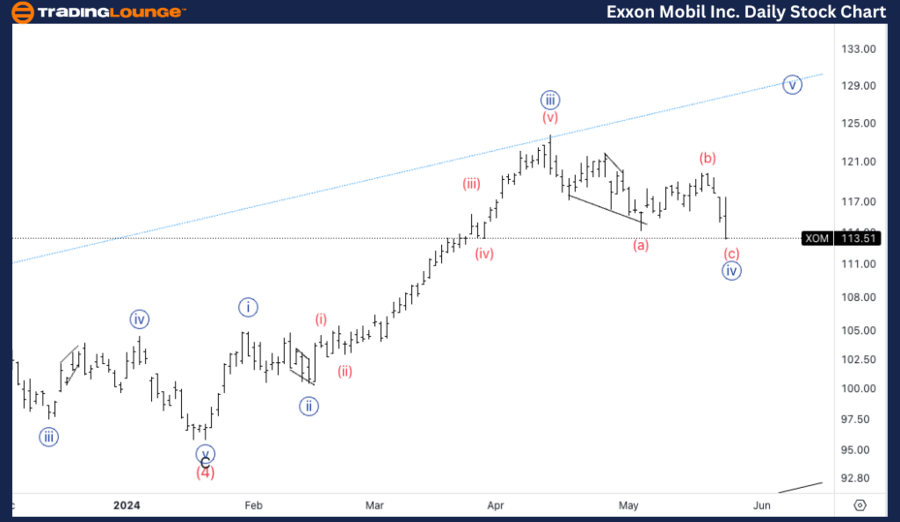
Exxon Mobil Inc., (XOM) Daily Chart
XOM Elliott Wave technical analysis
Function: Counter Trend.
Mode: Corrective.
Structure: ZigZag.
Position: Wave {iv} of 1.
Direction: Bottom in wave {iv}.
Details: Correcting deeper than expected in wave {iv}, but we could still turn higher as we approach 110$.
XOM Elliott Wave technical analysis – Daily chart
In our Elliott Wave analysis of Exxon Mobil Inc. (XOM). we observe a counter-trend corrective pattern characterized by a ZigZag structure. XOM is currently positioned in wave {iv} of 1, indicating a bottom in wave {iv}. Despite a deeper than expected correction in wave {iv}, there is potential for a reversal as XOM approaches the $110 level. Traders should monitor this key support area for signs of a turn higher, which could signal the resumption of the primary trend.
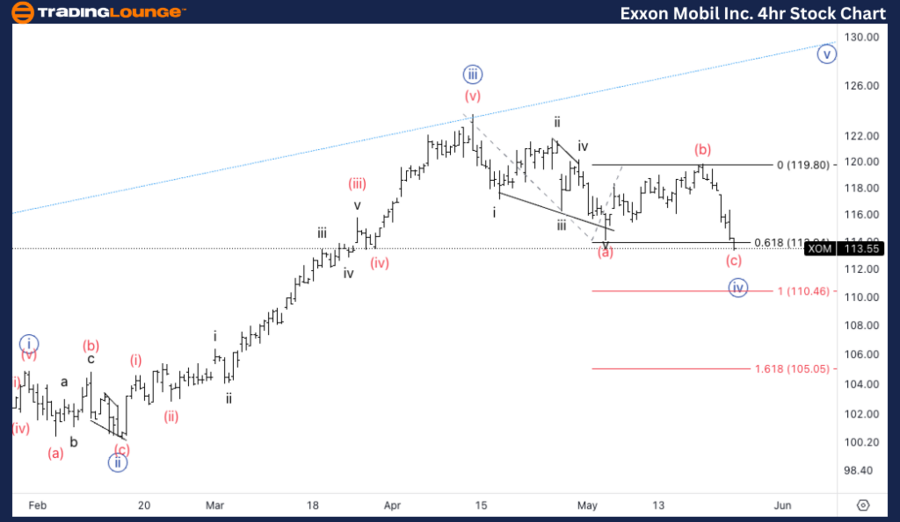
XOM Elliott Wave technical analysis – Four-hour chart
On the 4-hour chart, XOM is following a counter-trend corrective mode within a ZigZag structure, specifically in wave (c) of {ii}. The current analysis shows that XOM is at the 0.618 Fibonacci retracement level of (c) vs. (a), suggesting a potential bottom in wave (c). If this level holds, the next target would be the equality of (c) vs. (a) at $110. Traders should watch for a bullish turn at this level, which could provide a strategic entry point for long positions.
Function: Counter Trend.
Mode: Corrective.
Structure: ZigZag.
Position: Wave (c) of {ii}.
Direction: Bottom in wave (c).
Details: We are at 0.618 (c) vs. (a). Looking for a turn soon, next target would be equality of (c) vs. (a) at 110$.
Welcome to our latest Elliott Wave analysis for Exxon Mobil Inc. (XOM) as of May 24, 2024. This analysis provides an in-depth look at XOM's price movements using the Elliott Wave Theory, helping traders identify potential opportunities based on current trends and market structure. We will cover insights from both the daily and 4-hour charts to offer a comprehensive perspective on XOM's market behavior.
XOM Elliott Wave technical analysis [Video]
Author

Peter Mathers
TradingLounge
Peter Mathers started actively trading in 1982. He began his career at Hoei and Shoin, a Japanese futures trading company.

















