Euro retreats on rising geopolitical tensions, mixed Eurozone data, and higher Oil prices
- EUR/USD pulls back after rejection at 1.1660 and remains trapped within the last two weeks' range.
- Rising US-Iran tensions and higher Oil prices are undermining risk appetite on Monday.
- Eurozone data confirms a slowdown in manufacturing activity in May, with unemployment steady.

The Euro (EUR) prints minor losses against the US Dollar (USD) on Monday, with momentum indicators pointing to fading bullish strength after rejection at the recent range top of 1.1660. Mixed Eurozone data, rising tensions in the Middle East, and higher Oil prices are acting as headwinds for the common currency
Iran's Foreign Minister Abbas Araghchi posted on X earlier on Monday that the ceasefire between the US and Iran constitutes a truce on all fronts, including Lebanon, and that a violation of this agreement on one front will be considered a violation on all fronts.
These remarks come after the US and Iran exchanged strikes, and Israel ramped up its operations in Lebanon over the weekend, casting doubt about a negotiated end to the conflict. Oil prices have appreciated by more than 3% from last week's close.
In Europe, May's HCOB Manufacturing Purchasing Managers’ Index (PMI) was revised up to 51.6, from the previously estimated 51.4, although it remains below April’s 52.2 level. Later on, Eurostat data revealed that the Unemployment Rate remained unchanged at 6.3% in April, against expectations of a decline to 6.2%.
In the US, the ISM PMI is expected to show levels consistent with the healthy expansion of the sector’s activity. The main focus this week, however, will be on a string of employment releases, including Friday’s Nonfarm Payrolls report, which are likely to provide further insight into the US Federal Reserve’s (Fed) monetary policy.
Technical Analysis: Capped below the 1.1660 range top
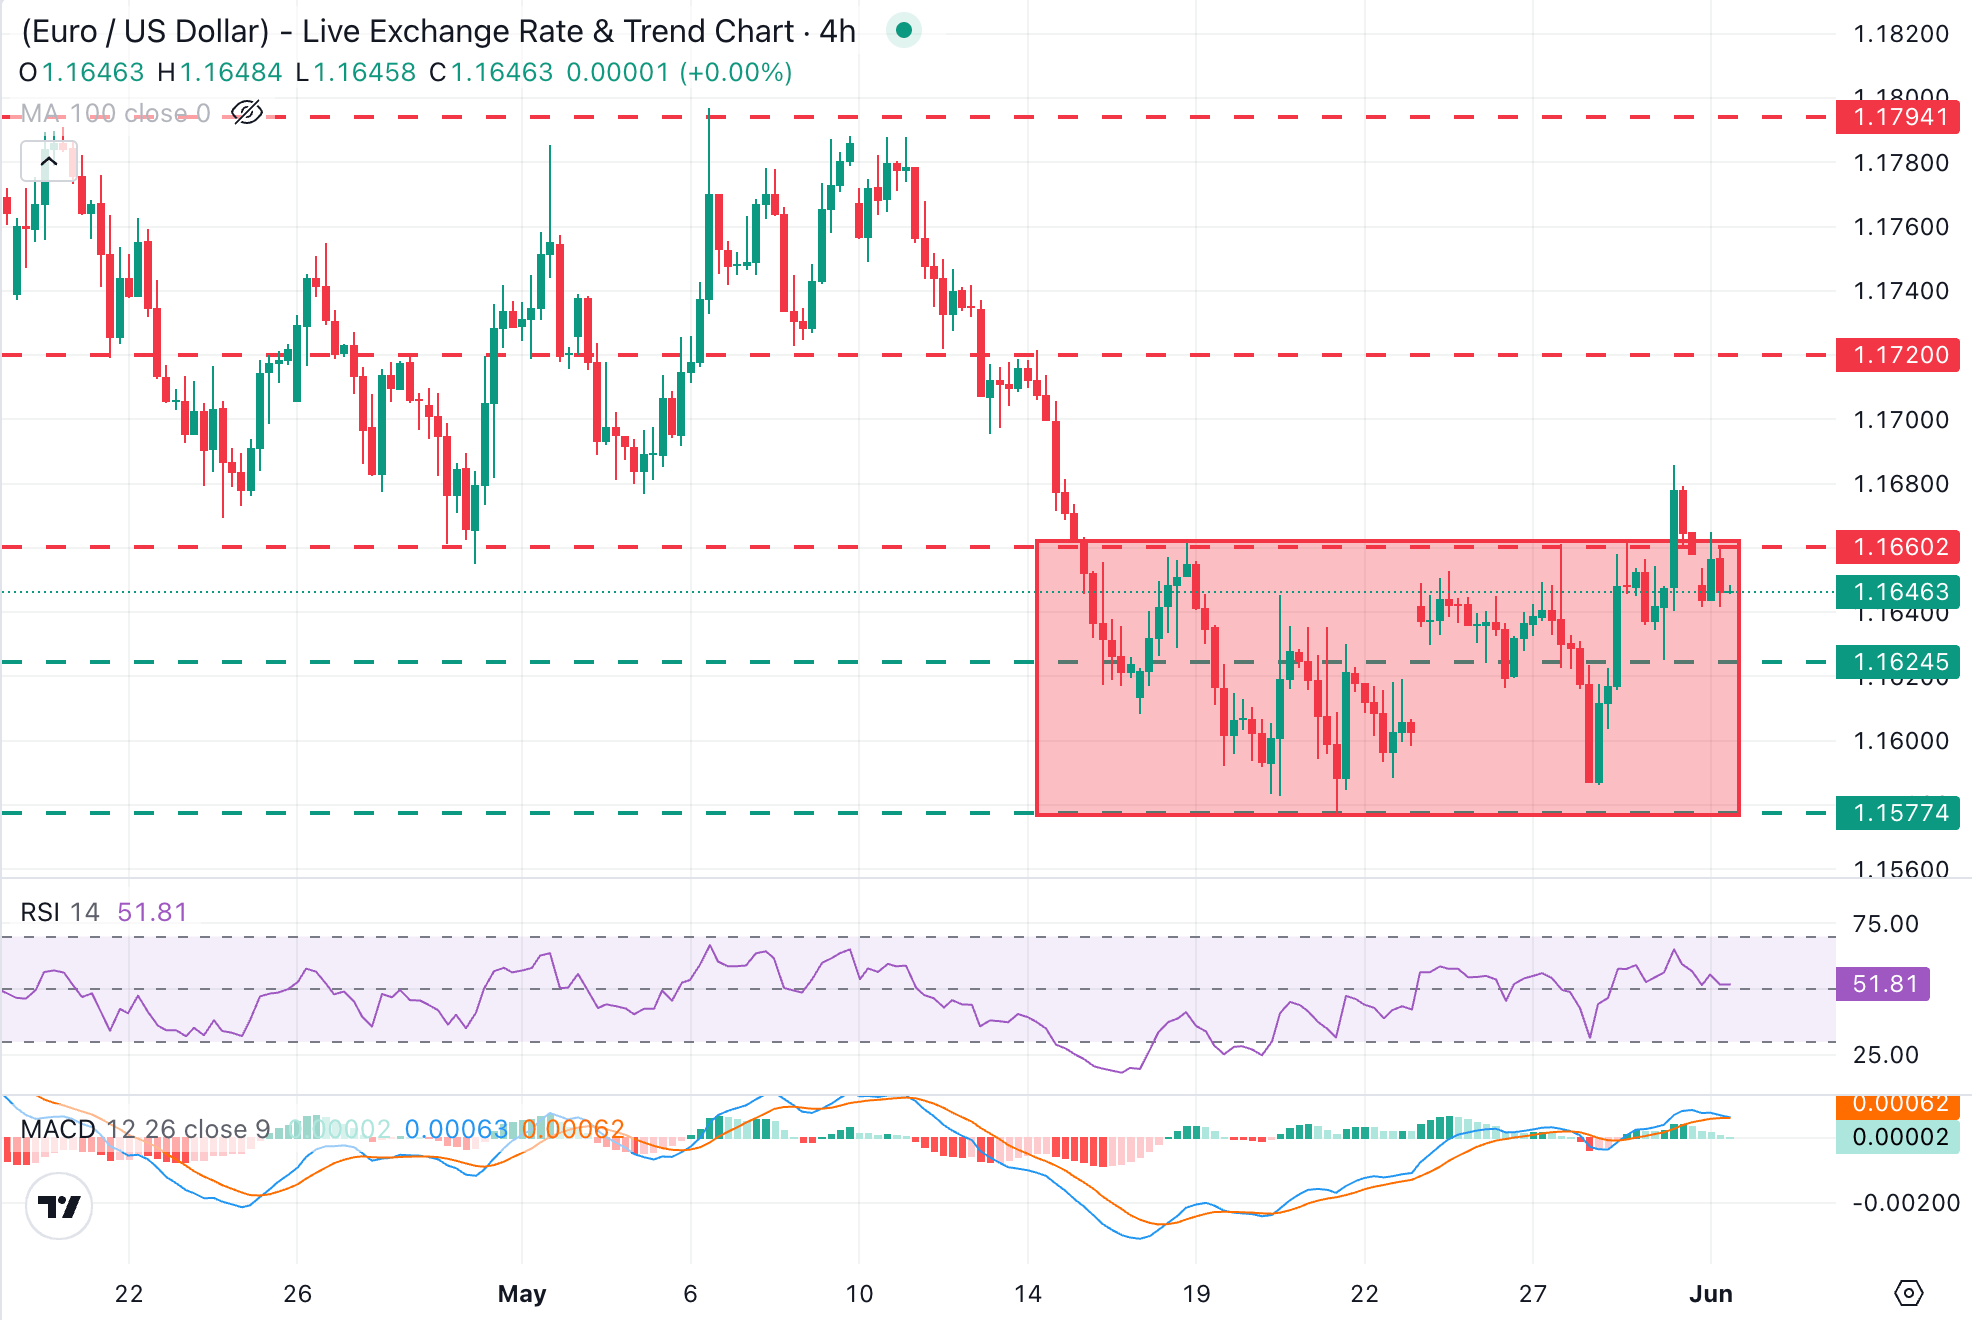
EUR/USD trades at 1.1646, with indicators on intraday charts showing a faltering momentum. The 4-hour Relative Strength Index (RSI) is drifting towards the 50 line, while the Moving Average Convergence Divergence (MACD) line is about to cross below the Signal line, which is a bearish sign.
On the topside, the May 18, 27, and 28 highs at 1.1660 keep holding bulls despite last week's false break. Above here, the May 14 high, at 1.1720, and May's peak, in the 1.1790 area, emerge as the next targets.
Downside attempts are likely to be tested at Friday's lows, at 1.1625, ahead of the range bottom, in the 1.1575 area.
(The technical analysis of this story was written with the help of an AI tool.)
Economic Indicator
ISM Manufacturing PMI
The Institute for Supply Management (ISM) Manufacturing Purchasing Managers Index (PMI), released on a monthly basis, is a leading indicator gauging business activity in the US manufacturing sector. The indicator is obtained from a survey of manufacturing supply executives based on information they have collected within their respective organizations. Survey responses reflect the change, if any, in the current month compared to the previous month. A reading above 50 indicates that the manufacturing economy is generally expanding, a bullish sign for the US Dollar (USD). A reading below 50 signals that factory activity is generally declining, which is seen as bearish for USD.
Read more.Next release: Mon Jun 01, 2026 14:00
Frequency: Monthly
Consensus: 53
Previous: 52.7
Source: Institute for Supply Management
The Institute for Supply Management’s (ISM) Manufacturing Purchasing Managers Index (PMI) provides a reliable outlook on the state of the US manufacturing sector. A reading above 50 suggests that the business activity expanded during the survey period and vice versa. PMIs are considered to be leading indicators and could signal a shift in the economic cycle. Stronger-than-expected prints usually have a positive impact on the USD. In addition to the headline PMI, the Employment Index and the Prices Paid Index numbers are watched closely as they shine a light on the labour market and inflation.
Author

Guillermo Alcala
FXStreet
Graduated in Communication Sciences at the Universidad del Pais Vasco and Universiteit van Amsterdam, Guillermo has been working as financial news editor and copywriter in diverse Forex-related firms, like FXStreet and Kantox.