Euro hovers near lows on risk-off markets, with ECB’s Lagarde on tap
- EUR/USD extends losses for the third consecutive day and consolidates below 1.1700.
- Investors' fears of the resumption of hostilities between the US and Iran have crushed risk appetite.
- The pair approaches a key support area below 1.1675.

The Euro (EUR) trades lower for the third consecutive day against the US Dollar (USD) on Tuesday. The pair trades at 1.1685 as investors' concerns about the resumption of the hostilities in Iran keep risk appetite subdued, with the focus shifting to the European Central Bank’s (ECB) President Christine Lagarde’s speech.
US President Donald Trump’s decision to free vessels stranded in the Strait of Hormuz stirred the hornet's nest on Monday. At least one ship has been reported crossing the waterway, scorted by US military, but several others have reported fires and explosions, and Iranian missiles hit an Oil port in the United Arab Emirates (UAE) that hosts a military base.
These skirmishes are keeping investors on edge about a full resumption of the conflict, while Oil prices remain well above the $100 level. The US benchmark West Texas Intermediate (WTI) trades at $101.40 at the time of writing, and Brent Oil at $111.58, approaching four-year highs at $114.30. These prices put Eurozone Crude-importing economies under significant pressure and pose a strong weight on the Euro.
Later in the day, European Central Bank President Christine Lagarde will speak in Frankfurt and might give further details about the central bank’s monetary tightening, after several voices from the committee called for a rate hike in June or July.
In the US front, the S&P Global Services Purchasing Managers’ Index (PMI) and the ISM Services PMI will be the main focus on Tuesday, ahead of April’s jobs reports due later this week.
Technical Analysis: Bears eye the 1.1645-1.1675 support area
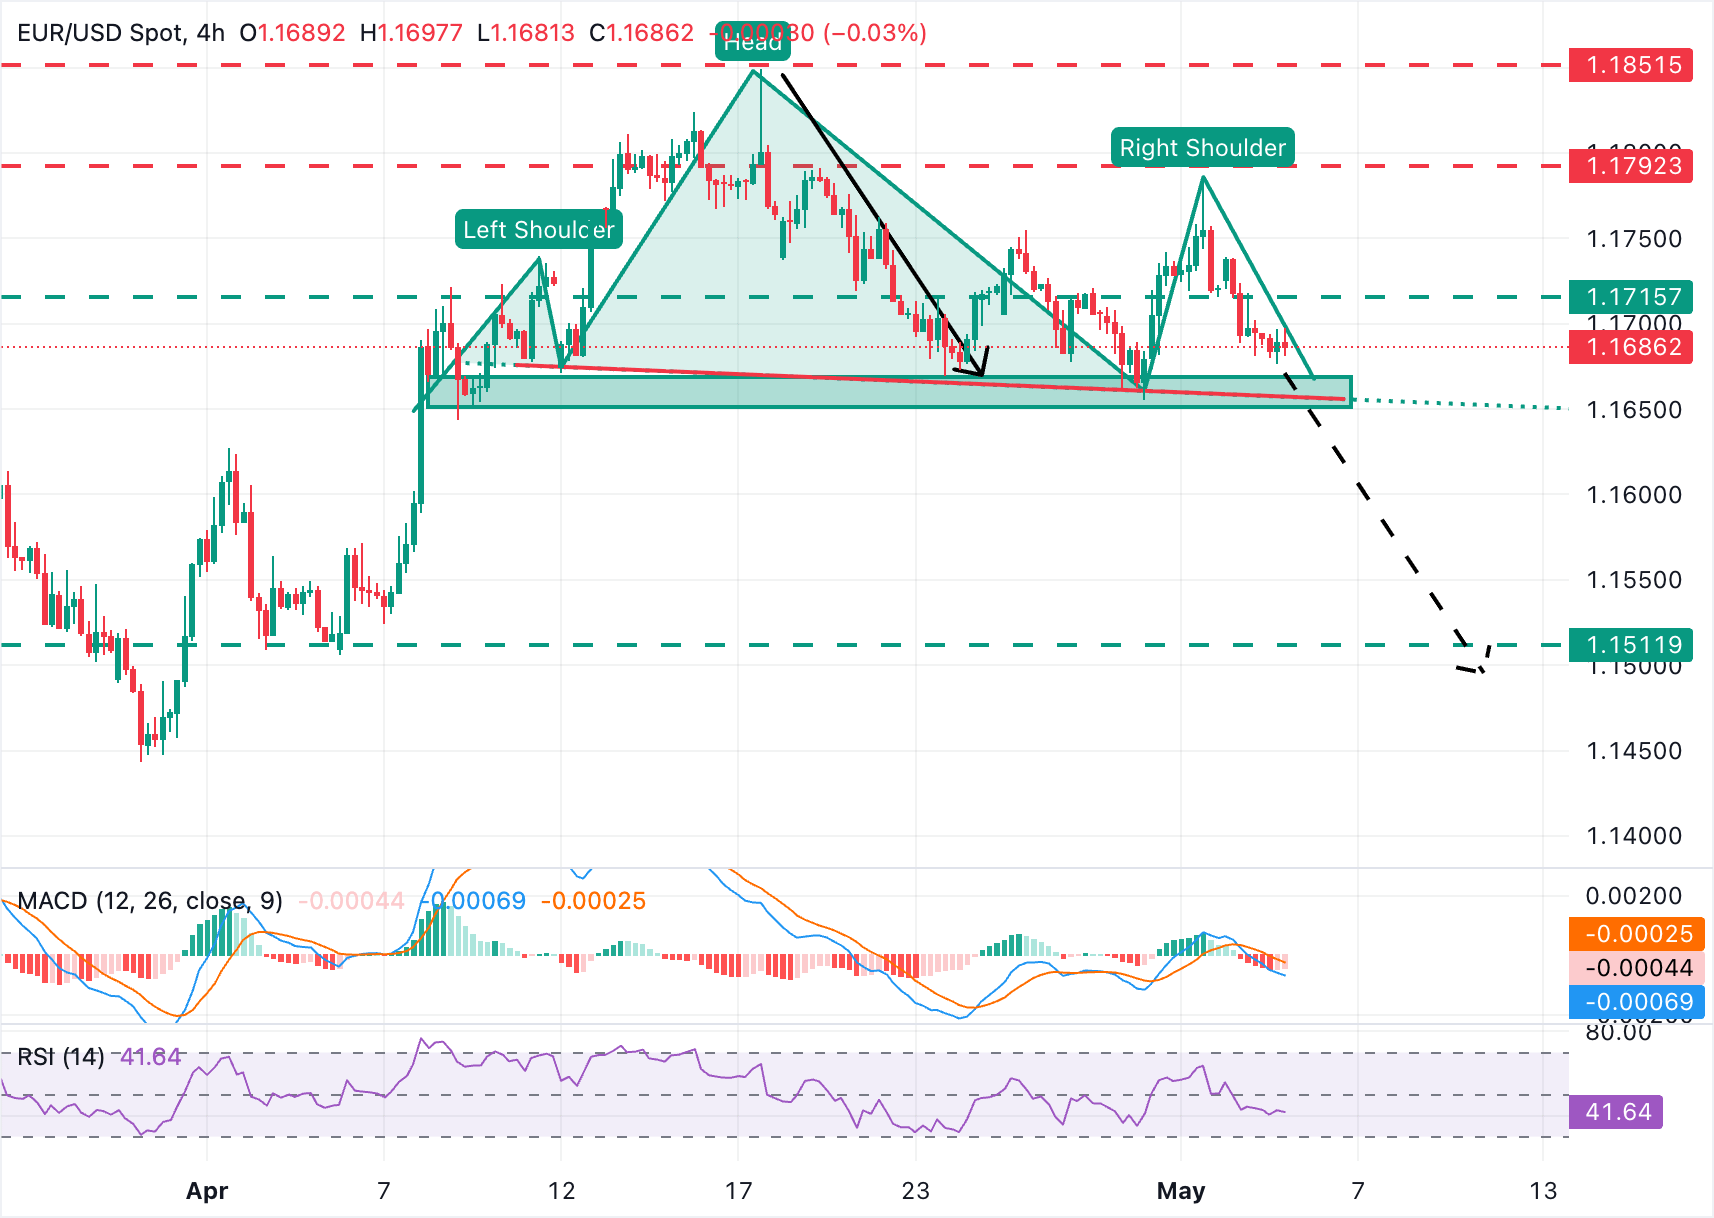
EUR/USD is showing a growing bearish momentum on the 4-hour chart, with price action nearing the support area between 1.1645 and 1.1675, which has held downside attempts several times in April.
Momentum indicators are deepening within bearish territory. The 4-hour Relative Strength Index (RSI) dives to around 40, while the Moving Average Convergence Divergence (MACD) drifts into negative territory, highlighting a mildly bearish tone.
Bears, however, are likely to need additional impetus to break the mentioned support area above 1.1645. A confirmation below here would activate a bearish Head & Shoulders pattern, with a measured target just below April lows in the 1.1500 area.
On the upside, Friday's low, at 1.1715, might act as resistance ahead of the April 20 and May 1 highs in the area between 1.1785 and 1.1795, and the April 17 high, near 1.1850.
(The technical analysis of this story was written with the help of an AI tool.)
Economic Indicator
ECB's President Lagarde speech
The European Central Bank's President Christine Lagarde, born in 1956 in France, has formerly served as Managing Director of the International Monetary Fund, and minister of finance in France. She began her eight-year term at the helm of the ECB in November 2019. As part of her job in the Governing Council, Lagarde holds press conferences in detailing how the ECB observes the current and future state of the European economy. Her comments may positively or negatively the Euro's trend in the short term. Usually, a hawkish outlook boosts the Euro (bullish), while a dovish one weighs on the common currency (bearish).
Read more.Next release: Tue May 05, 2026 12:30
Frequency: Irregular
Consensus: -
Previous: -
Source: European Central Bank
Economic Indicator
ISM Services PMI
The Institute for Supply Management (ISM) Services Purchasing Managers Index (PMI), released on a monthly basis, is a leading indicator gauging business activity in the US services sector, which makes up most of the economy. The indicator is obtained from a survey of supply executives across the US based on information they have collected within their respective organizations. Survey responses reflect the change, if any, in the current month compared to the previous month. A reading above 50 indicates that the services economy is generally expanding, a bullish sign for the US Dollar (USD). A reading below 50 signals that services sector activity is generally declining, which is seen as bearish for USD.
Read more.Next release: Tue May 05, 2026 14:00
Frequency: Monthly
Consensus: 53.7
Previous: 54
Source: Institute for Supply Management
The Institute for Supply Management’s (ISM) Services Purchasing Managers Index (PMI) reveals the current conditions in the US service sector, which has historically been a large GDP contributor. A print above 50 shows expansion in the service sector’s economic activity. Stronger-than-expected readings usually help the USD gather strength against its rivals. In addition to the headline PMI, the Employment Index and the Prices Paid Index numbers are also watched closely by investors as they provide useful insights regarding the state of the labour market and inflation.
Author

Guillermo Alcala
FXStreet
Graduated in Communication Sciences at the Universidad del Pais Vasco and Universiteit van Amsterdam, Guillermo has been working as financial news editor and copywriter in diverse Forex-related firms, like FXStreet and Kantox.














