EUR/USD Price Forecast: Drops below 200-day SMA, targets 1.1500 level
- EUR/USD drops 0.38% to 1.1567 after failing at the 200-day SMA near 1.1672.
- Break below 1.1500 could expose 1.1468 and 1.1450 support levels.
- Bulls must reclaim 1.1600 to retest the 200-day SMA and 1.1700 resistance.

The EUR/USD tumbles for the second straight day after clashing with the 200-day Simple Moving Average (SMA) at 1.1672 on Tuesday, due to overall US Dollar strength. Speculation that the Fed won’t cut rates in the short term and high US Treasury yields boosted the Dollar, a headwind for the shared currency. At the time of writing, the pair trades at 1.1567, down 0.38%.
EUR/USD Price Forecast: Technical Outlook
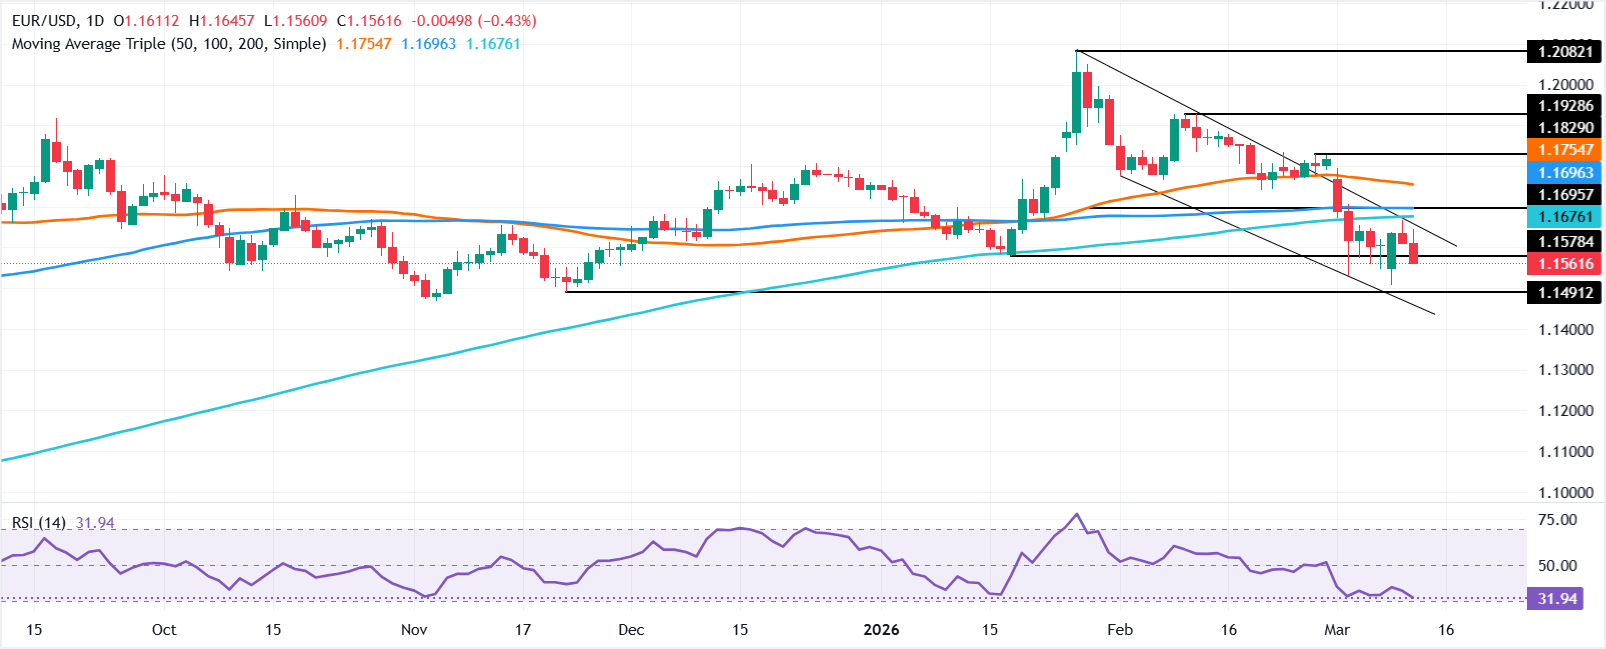
The EUR/USD has been trading sideways after peaking at around 1.2082 on January 27 before retracing towards the 1.1700 area. Since then, the pair achieved a successive series of lower highs and lower lows, bottoming at 1.1507, before bouncing off the lows towards the current exchange rate.
As of writing, the EUR/USD trade is below the 200-day Simple Moving Average (SMA) at 1.1672, suggesting that in the long term the pair turned bearish, after clearing the 200-day SMA on March 3.
For a bearish continuation, the EUR/USD must clear the 1.1500 figure. If broken, the next area of interest would be the November 5, 2025, daily low at 1.1468, followed by 1.1450. On further weakness, the August 1, 2025, low emerges as the next line of demand at 1.1391.
Conversely, bulls must regain 1.1600 before challenging the 200-day SMA at 1.1672. Once those two levels are surpassed, the next line of supply will be at 1.1700.
EUR/USD Price Chart – Daily
Euro Price Today
The table below shows the percentage change of Euro (EUR) against listed major currencies today. Euro was the strongest against the Japanese Yen.
| USD | EUR | GBP | JPY | CAD | AUD | NZD | CHF | |
|---|---|---|---|---|---|---|---|---|
| USD | 0.41% | 0.11% | 0.56% | 0.11% | -0.29% | 0.43% | 0.27% | |
| EUR | -0.41% | -0.29% | 0.13% | -0.30% | -0.69% | 0.02% | -0.13% | |
| GBP | -0.11% | 0.29% | 0.43% | -0.00% | -0.41% | 0.32% | 0.16% | |
| JPY | -0.56% | -0.13% | -0.43% | -0.46% | -0.85% | -0.15% | -0.30% | |
| CAD | -0.11% | 0.30% | 0.00% | 0.46% | -0.39% | 0.33% | 0.16% | |
| AUD | 0.29% | 0.69% | 0.41% | 0.85% | 0.39% | 0.72% | 0.59% | |
| NZD | -0.43% | -0.02% | -0.32% | 0.15% | -0.33% | -0.72% | -0.16% | |
| CHF | -0.27% | 0.13% | -0.16% | 0.30% | -0.16% | -0.59% | 0.16% |
The heat map shows percentage changes of major currencies against each other. The base currency is picked from the left column, while the quote currency is picked from the top row. For example, if you pick the Euro from the left column and move along the horizontal line to the US Dollar, the percentage change displayed in the box will represent EUR (base)/USD (quote).
Author

Christian Borjon Valencia
FXStreet
Markets analyst, news editor, and trading instructor with over 14 years of experience across FX, commodities, US equity indices, and global macro markets.

















