EUR/USD Price Forecast: 20-day EMA caps recovery, flash German HICP data awaited
- EUR/USD reflects a subdued performance near 1.1640, while investors await US President Trump’s approval of the Iran agreement.
- Investors await the preliminary German HICP data for May, which will be released later in the day.
- The Symmetrical Triangle formation exhibits a sharp volatility contraction.

The EUR/USD pair trades subduedly at around 1.1640 during the European trading session on Friday. The major currency pair edges down as the US Dollar (USD) ticks higher, with investors awaiting United States (US) President Donald Trump’s approval OF the 60-day Memorandum of Understanding (MoU) with Iran.
At press time, the US Dollar Index (DXY), which tracks the Greenback’s value against six major currencies, is marginally up to near 99.10, but is still close to its Thursday’s low of 98.95.
On Thursday, media reports showed that the US-Iran agreement of a 60-day MoU has been finalized, which includes uninterrupted energy flows through the Strait of Hormuz and the removal of the US blockade on Iranian sea ports, but needs final approval from US President Trump.
Meanwhile, investors await the preliminary German Harmonized Index of Consumer Prices (HICP) data for May, which will be published at 12:00 GMT. Month-on-month HICP is estimated to have grown at a moderate pace of 0.2% against 0.5% in April. On an annualized basis, the German HICP growth is expected to have cooled down to 2.8% from the previous reading of 2.9%.
Ahead of the German HICP data, the inflation of Germany's six states shows that price pressures cooled down in all of them.
EUR/USD technical analysis
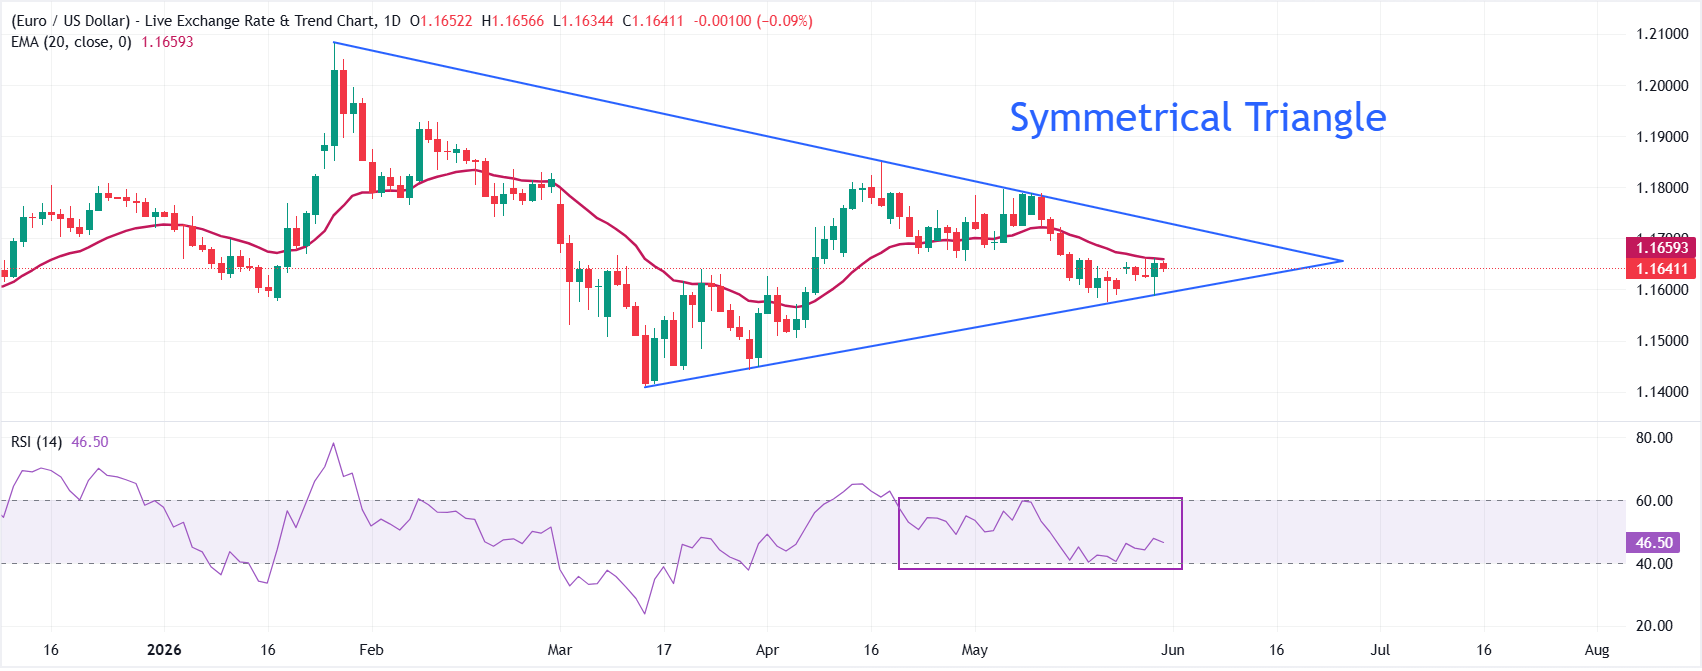
EUR/USD trades almost flat at around 1.1640. The major currency pair remains capped by the 20-period Exponential Moving Average (EMA), which is at 1.1659. The formation of the Symmetrical Triangle chart pattern with the Relative Strength Index (14) oscillating inside the 40.00-60.00 zone hints at a lack of directional conviction.
On the topside, initial resistance is located at the 20-period EMA near 1.1660, followed by the former resistance trend-line break level at 1.1732, where sellers could look to reassert control if tested. On the downside, the key structural floor is the upward support trend-line break level at 1.1592; a sustained drop below that zone would likely reinforce the prevailing bearish bias and open the door to a deeper retracement towards 1.1500.
(The technical analysis of this story was written with the help of an AI tool.)
Economic Indicator
Harmonized Index of Consumer Prices (YoY)
The Harmonized Index of Consumer Prices (HICP), released by the German statistics office Destatis on a monthly basis, is an index of inflation based on a statistical methodology that has been harmonized across all European Union (EU) member states to facilitate comparisons. The YoY reading compares prices in the reference month to a year earlier. Generally, a high reading is bullish for the Euro (EUR), while a low reading is bearish.
Read more.Next release: Fri May 29, 2026 12:00 (Prel)
Frequency: Monthly
Consensus: 2.8%
Previous: 2.9%
Author

Sagar Dua
FXStreet
Sagar Dua is associated with the financial markets from his college days. Along with pursuing post-graduation in Commerce in 2014, he started his markets training with chart analysis.
















