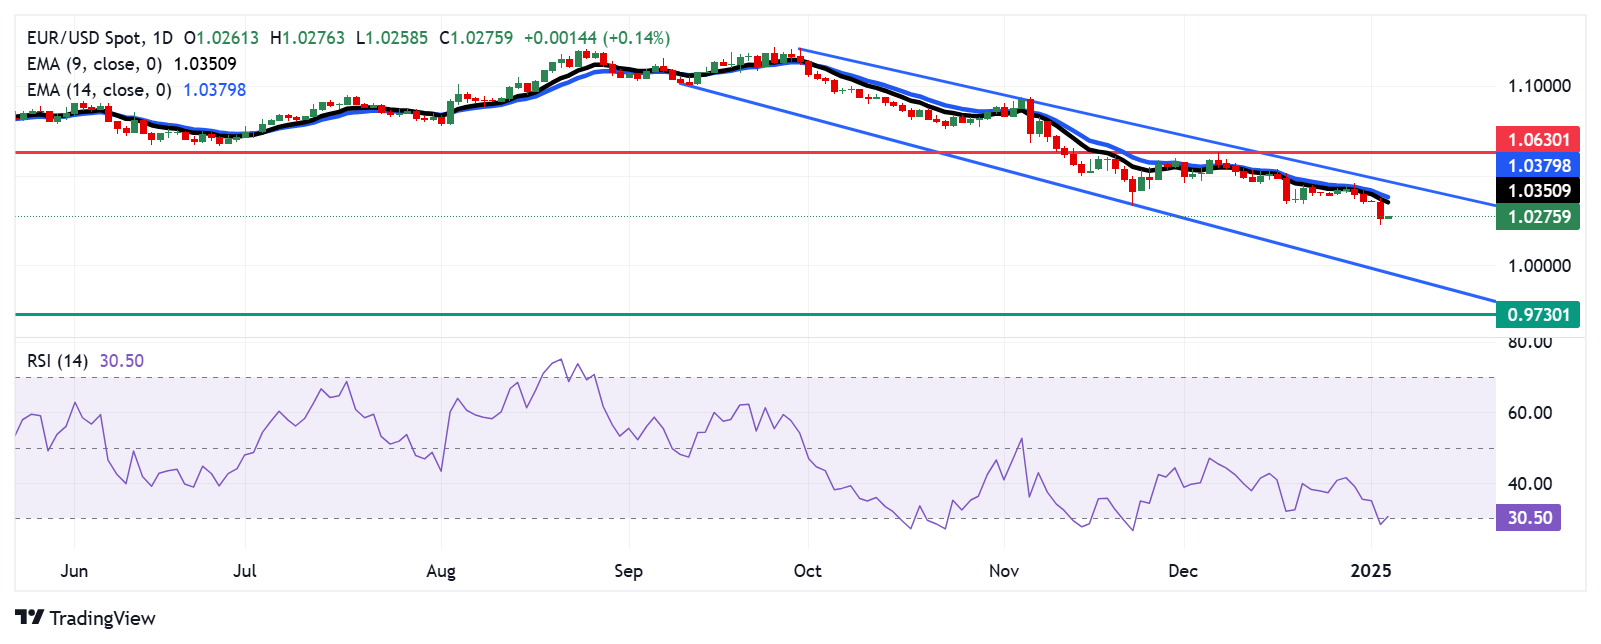
EUR/USD Price Analysis: Finds support near 1.0250 within oversold territory
- EUR/USD may appreciate further as the 14-day RSI indicates an upward correction soon.
- The initial barrier appears around the nine-day EMA at 1.0350.
- The pair may navigate the support region around the psychological level of 1.0000.

The EUR/USD pair pauses its four-day losing streak, trading near 1.0270 during the Asian session on Friday. A review of the daily chart suggests a persistent bearish bias, with the pair moving downward within a descending channel pattern.
The 14-day Relative Strength Index (RSI), a crucial momentum indicator, hovers near the 30 level, indicating an oversold condition and the possibility of an upward correction in the near term. However, the nine-day Exponential Moving Average (EMA) remains below the 14-day EMA, signaling weaker short-term price momentum and reinforcing the overall bearish sentiment.
The EUR/USD pair could find the primary resistance level around the nine-day Exponential Moving Average (EMA) at 1.0350, followed by the 14-day EMA at 1.0379. If the pair breaks above these levels, it could aim for the descending channel's upper boundary at 1.0470, with further gains potentially extending to the seven-week high of 1.0630.
On the downside, the EUR/USD pair may navigate the region around the psychological support level of 1.0000, followed by the lower boundary of the descending channel at 0.9970. A decisive break below 0.9970 could intensify the bearish bias, potentially driving the pair further down to test 0.9730, the lowest level seen since November 2022.
EUR/USD: Daily Chart
Euro PRICE Today
The table below shows the percentage change of Euro (EUR) against listed major currencies today. Euro was the strongest against the US Dollar.
| USD | EUR | GBP | JPY | CAD | AUD | NZD | CHF | |
|---|---|---|---|---|---|---|---|---|
| USD | -0.16% | -0.20% | -0.28% | -0.11% | -0.25% | -0.30% | -0.21% | |
| EUR | 0.16% | -0.04% | -0.15% | 0.05% | -0.09% | -0.14% | -0.04% | |
| GBP | 0.20% | 0.04% | -0.06% | 0.09% | -0.05% | -0.10% | -0.01% | |
| JPY | 0.28% | 0.15% | 0.06% | 0.18% | 0.03% | -0.01% | 0.08% | |
| CAD | 0.11% | -0.05% | -0.09% | -0.18% | -0.15% | -0.19% | -0.12% | |
| AUD | 0.25% | 0.09% | 0.05% | -0.03% | 0.15% | -0.05% | 0.06% | |
| NZD | 0.30% | 0.14% | 0.10% | 0.01% | 0.19% | 0.05% | 0.09% | |
| CHF | 0.21% | 0.04% | 0.01% | -0.08% | 0.12% | -0.06% | -0.09% |
The heat map shows percentage changes of major currencies against each other. The base currency is picked from the left column, while the quote currency is picked from the top row. For example, if you pick the Euro from the left column and move along the horizontal line to the US Dollar, the percentage change displayed in the box will represent EUR (base)/USD (quote).
Author

Akhtar Faruqui
FXStreet
Akhtar Faruqui is a Forex Analyst based in New Delhi, India. With a keen eye for market trends and a passion for dissecting complex financial dynamics, he is dedicated to delivering accurate and insightful Forex news and analysis.


