EUR/JPY Price Forecast: Slides below 184 as bears target 100-day SMA
- EUR/JPY drops after Japan signals potential FX intervention action.
- Break below 20- and 50-day SMAs accelerates downside pressure.
- Recovery above 184.00 needed to shift momentum back to bulls.
The EUR/JPY retreats on Monday, down some 0.78%, as Japanese authorities verbally intervened in the FX markets, threatening to take action, after the currency chief, Atsushi Mimura, said the nation may take "bold action" due to the Yen's appreciation. At the time of writing, the cross-pair trades at
EUR/JPY Price Forecast: Technical Outlook
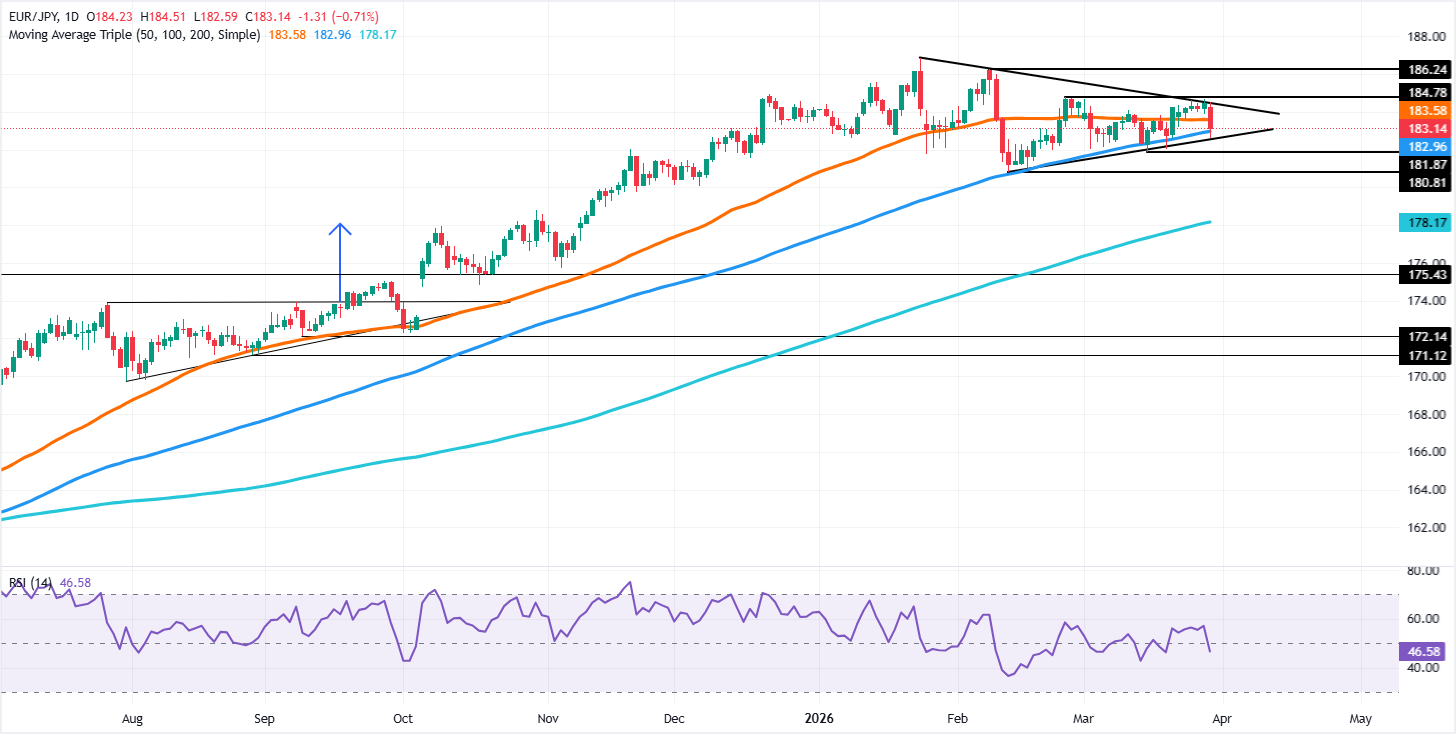
At the time of writing, the EUR/JPY has surpassed key support levels, including the confluence of the 50- and 20-day Simple Moving Averages (SMAs) around 183.53/48, which has exacerbated a fall towards 183.00. Despite edging lower in the near term, the pair remains far from definitively shifting the bias to bearish, as it remains above the February 17 daily low of 180.82. Nevertheless, on its way down, it would face support at the 100-day SMA at 182.91.
Momentum, although bearish, as depicted in the Relative Strength Index (RSI), remains close to its neutral level. This means that buyers, despite being on the sidelines, can step up and push the cross-pair higher.
If the EUR/JPY conquer the 184.00 figure, the next resistance would be the March 27 high at 184.66, followed by the 185.00 mark. On further strength, the rally could extend towards the February 9 high at 186.23 ahead of the yearly peak at 186.87.
EUR/JPY Price Chart – Daily
Euro Price This week
The table below shows the percentage change of Euro (EUR) against listed major currencies this week. Euro was the strongest against the Australian Dollar.
| USD | EUR | GBP | JPY | CAD | AUD | NZD | CHF | |
|---|---|---|---|---|---|---|---|---|
| USD | 0.02% | -0.04% | 0.02% | -0.01% | 0.01% | 0.00% | -0.04% | |
| EUR | -0.02% | 0.01% | 0.00% | 0.01% | 0.06% | -0.00% | 0.01% | |
| GBP | 0.04% | -0.01% | 0.02% | -0.00% | 0.03% | 0.03% | 0.02% | |
| JPY | -0.02% | 0.00% | -0.02% | -0.03% | -0.15% | -0.01% | 0.03% | |
| CAD | 0.01% | -0.01% | 0.00% | 0.03% | -0.04% | 0.00% | 0.02% | |
| AUD | -0.01% | -0.06% | -0.03% | 0.15% | 0.04% | 0.02% | -0.03% | |
| NZD | 0.00% | 0.00% | -0.03% | 0.01% | -0.01% | -0.02% | -0.01% | |
| CHF | 0.04% | -0.01% | -0.02% | -0.03% | -0.02% | 0.03% | 0.00% |
The heat map shows percentage changes of major currencies against each other. The base currency is picked from the left column, while the quote currency is picked from the top row. For example, if you pick the Euro from the left column and move along the horizontal line to the US Dollar, the percentage change displayed in the box will represent EUR (base)/USD (quote).
Author

Christian Borjon Valencia
FXStreet
Markets analyst, news editor, and trading instructor with over 14 years of experience across FX, commodities, US equity indices, and global macro markets.