|

EUR/JPY Price Analysis: Uptrend stalls at 159.00, as buyers target 159.70s YTD high

  • EUR/JPY climbs for the second straight day, breaking above 158.92, but closes at 158.74.
  • BoJ's ultra-loose monetary policy pressures JPY, while positive EU data reduces a possible ECB rate hike.
  • Technical analysis shows potential for further gains, with YTD high at 159.76 as next target for buyers.

EUR/JPY climbed for the second straight day, breaking above last Thursday’s high of 158.92, though it retreated some and printed a daily close of 158.74, registering gains of 0.19%.

The fundamental backdrop has not changed, as risk aversion was the price action driver during the week, while the Bank of Japan’s (BoJ) commitment to its ultra-loose monetary policy pressured the Japanese Yen (JPY). Meanwhile, the Eurozone’s (EU) more positive economic data has pushed aside the likelihood of a European Central Bank (ECB) rate hike, but the Euro (EUR) is not out of the woods yet. Recessionary fears loom, along with inflation twice the ECB’s target, increased speculations for a stagflationary scenario.

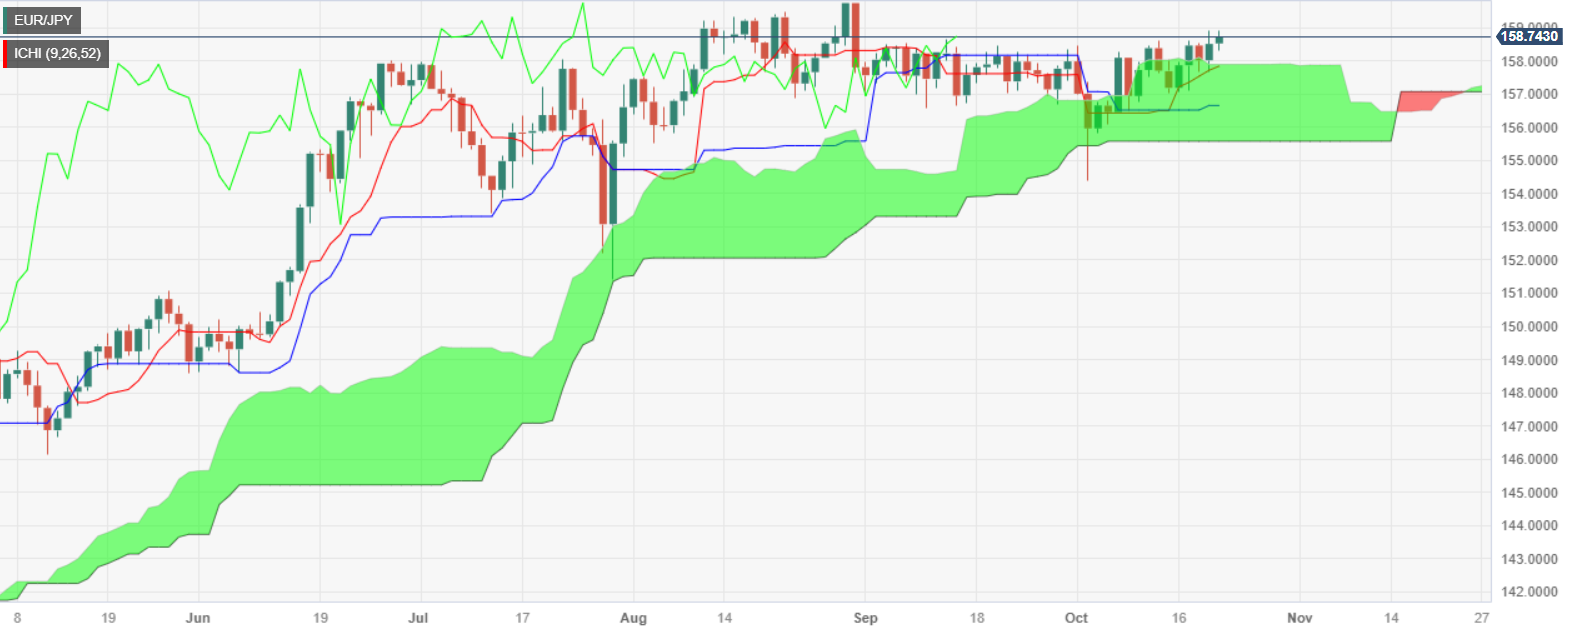
From a technical perspective, the EUR/JPY’s lack of clear direction keeps the pair trading sideways, though slightly tilted to the upside. If the cross-pair breaks above 159.00, buyers could test the year-to-date (YTD) high at 159.76.

Conversely, if EUR/JPY sellers moved in, the first support would be the 158.00 figure, immediately followed by the top of the Ichimoku Cloud (Kumo) at 157.75/95. Once cleared, the cross would drip inside the Kumo, indicating sellers gathering momentum, with the next support seen at the Tenkan Sen at 157.85, followed by the Kijun-Sen at 156.64.

EUR/JPY Price Action – Daily chart

EUR/JPY Technical Levels

EUR/JPY

Overview
Today last price158.74
Today Daily Change0.23
Today Daily Change %0.15
Today daily open158.51
 
Trends
Daily SMA20157.56
Daily SMA50157.93
Daily SMA100156.54
Daily SMA200150.63
 
Levels
Previous Daily High158.93
Previous Daily Low157.68
Previous Weekly High158.61
Previous Weekly Low156.51
Previous Monthly High158.66
Previous Monthly Low156.58
Daily Fibonacci 38.2%158.45
Daily Fibonacci 61.8%158.16
Daily Pivot Point S1157.82
Daily Pivot Point S2157.13
Daily Pivot Point S3156.57
Daily Pivot Point R1159.07
Daily Pivot Point R2159.63
Daily Pivot Point R3160.32

Author

Christian Borjon Valencia

Markets analyst, news editor, and trading instructor with over 14 years of experience across FX, commodities, US equity indices, and global macro markets.

More from Christian Borjon Valencia
Share:

Editor's Picks

EUR/USD clings to modest gains above 1.1550 post-US CPI

EUR/USD stays in positive territory above 1.1550 in the American session on Wednesday. The data from the US showed that the annual CPI inflation climbed to 4.2% in May. This print came in line with the market expectation and made it difficult for the USD to gather strength.

GBP/USD pulls away from session highs, stays above 1.3400

GBP/USD stays in positive territory slightly above 1.3400 despite pulling away from session highs. The cautious market stance helps the US Dollar limit its losses and cap the pair's upside as investors assess the US inflation data, which showed that the CPI rose 4.2% on a yearly basis in May.

Gold trades at fresh 10-week low below $4,200

Gold builds on Tuesday’s losses and remains under heavy pressure, gyrating around the $4,150 mark per troy ounce as investors evaluate the latest US CPI data on Wednesday. Meanwhile, developments from the Middle East crisis and the likelihood of a more cautious Fed in the next few months continue to weigh on the yellow metal.

Crypto Today: Bitcoin, Ethereum, XRP face downside pressure amid investor de-risking

Major crypto assets trade under intense headwinds on Wednesday, as market participants navigate complex geopolitical and macroeconomic environments.

The market gets a CPI core reprieve, but Oil still holds the match
The market just got a temporary get-out-of-jail-free card, not a full pardon, but enough to keep the Fed’s hand off the rate hike lever as the tape exhales, at least for now. Headline CPI landed exactly where feared, with prices rising 0.5% MoM and 4.2% YoY, the hottest annual inflation print in more than three years and a clear acceleration from 3.8% in April.
The US economy defies the rules: 100 days into the Oil shock and the recession signal is still missing

More than three months after the start of the Iran war and the resulting disruption to global energy markets, the US economy continues to display remarkable resilience. The conflict has triggered a sharp rise in Oil prices, reignited inflationary pressures and fueled widespread concerns about a potential economic slowdown.