|

EUR/GBP rises as UK Q4 GDP data weighs

  • The EUR/GBP is trading at 0.8560, showing a gain of 0.25, in Thursday's American session.
  • ECB President Lagarde was on the wires but didn’t offer any insights.
  • The Sterling is weak due to lower-than-expected Q4 GDP data.

In Thursday's session, the EUR/GBP traded at 0.8560, showing a gain of 0.25% as the Sterling weakened due to softer-than-expected Q4 GDP data. However, the Bank of England (BoE) is expected to remain hawkish and the differing monetary policies with the European Central Bank (ECB) may eventually benefit the GBP.

In line with that, while markets expect the first rate cut in June by the ECB, economists foresee 125 bp of total easing within the next year, a decrease from the 150 bp predicted entered February and in case investors start to see less easing, the pair could continue rising.

Meanwhile, the UK saw its first consecutive quarters of contraction since early 2020, including a 0.3% QoQ decline in Q4, surpassing the 0.1% forecast. However, despite, the weak data, markets are expecting that the BoE won’t rush to cut rates, and as for now, the consensus is that the total easing will be between 75 bps and 100 bps in 2024. As long as the divergence between the BoE and ECB persists, the pound’s losses are limited.

EUR/GBP technical analysis

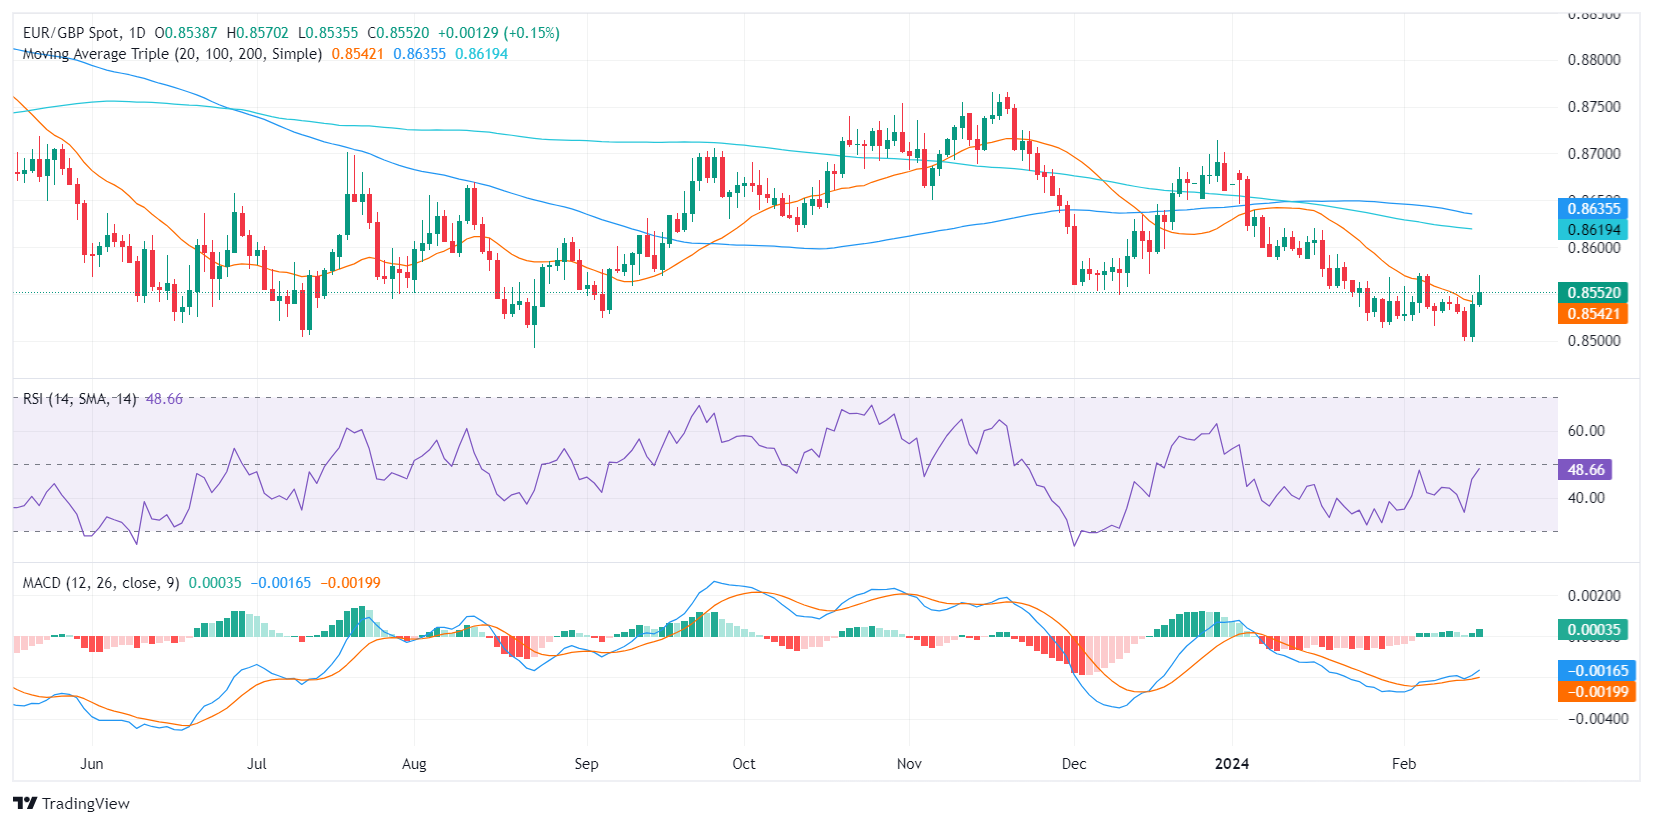
On the daily chart, the Relative Strength Index (RSI) for the EUR/GBP pair is currently near to jump to positive territory, indicating that buyers are gaining ground. In addition, the Moving Average Convergence Divergence (MACD) histogram has been consistently positive indicating that positive momentum is strong.

However, it is important to note that the broader perspective, represented by the Simple Moving Averages (SMAs), still favors sellers as the pair trades below the 100 and 200-day SMAs. That being said, the bulls managed to jump above the 20-day average so for the short term, the outlook might start to turn positive for them.

EUR/GBP daily chart
EUR/GBP

Overview
Today last price0.8551
Today Daily Change0.0012
Today Daily Change %0.14
Today daily open0.8539
 
Trends
Daily SMA200.8542
Daily SMA500.8592
Daily SMA1000.8635
Daily SMA2000.8619
 
Levels
Previous Daily High0.8549
Previous Daily Low0.8498
Previous Weekly High0.8572
Previous Weekly Low0.8516
Previous Monthly High0.8683
Previous Monthly Low0.8513
Daily Fibonacci 38.2%0.853
Daily Fibonacci 61.8%0.8518
Daily Pivot Point S10.8509
Daily Pivot Point S20.8478
Daily Pivot Point S30.8458
Daily Pivot Point R10.8559
Daily Pivot Point R20.8579
Daily Pivot Point R30.861

Author

Patricio Martín

Patricio is an economist from Argentina passionate about global finance and understanding the daily movements of the markets.


More from Patricio Martín
Share:

Editor's Picks

AUD/USD remains below 0.7000 amid light trading

AUD/USD fills a modest bearish gap on Monday, but remains below 0.7000 in the Asian session amid holiday-thinned liquidity. The US Dollar attempts a bounce even as US bond yields pull back from multi-year highs, limiting the pair. Moreover, diminishing odds of another RBA rate hike in November cap the Aussie.

USD/JPY hovers above 158.00 amid Japan/ US holiday

USD/JPY extends its range-bound price action into a new week, trading above 158.00 as bulls remain on high alert amid speculation that authorities will step in to prop up the Japanese Yen. Meanwhile, softer US bond yields keep US Dollar bulls on the back foot and cap the pair's upside. However, geopolitical uncertainties could limit losses for the safe-haven buck amid thin liquidity due to a holiday in Japan and the US.

Gold sticks to modest losses; seems vulnerable below $4,200 on Fed hike bets

Gold extends its intraday retracement slide from a one-week high, hitting a fresh daily low around $4,170 during the early European session. The US Dollar attracts fresh buyers after a modest downtick amid the US Federal Reserve's hawkish outlook, which, in turn, is seen as weighing on the non-yielding bullion.

Bitcoin struggles as ETF outflows, geopolitical uncertainty weigh

Bitcoin hovers around $83,600 on Monday after a 3.1% correction last week. US-listed spot ETFs recorded an outflow of $681.10 million last week, snapping the three-week inflow streak. Geopolitical uncertainty and mixed signals keep investors cautious.

The week ahead: A critical week as earnings and CPI test market

The Oil price is relatively stable this morning, and US and European stock markets are poised to open higher, as risk sentiment shrugs off an escalation in the Middle East and concerns about rising bond yields.

Has Bitcoin really escaped the macro forces it was built to fight?
Over 17 years ago, Satoshi Nakamoto designed Bitcoin (BTC) on the back of a global financial crisis as an alternative to the global monetary system outside the control of central banks, governments and traditional intermediaries. This raises a key question: has Bitcoin really become independent of the macroeconomic forces it was built to challenge?














