EUR/GBP Price Forecast: Extends gains past the 50-day SMA and 0.8300
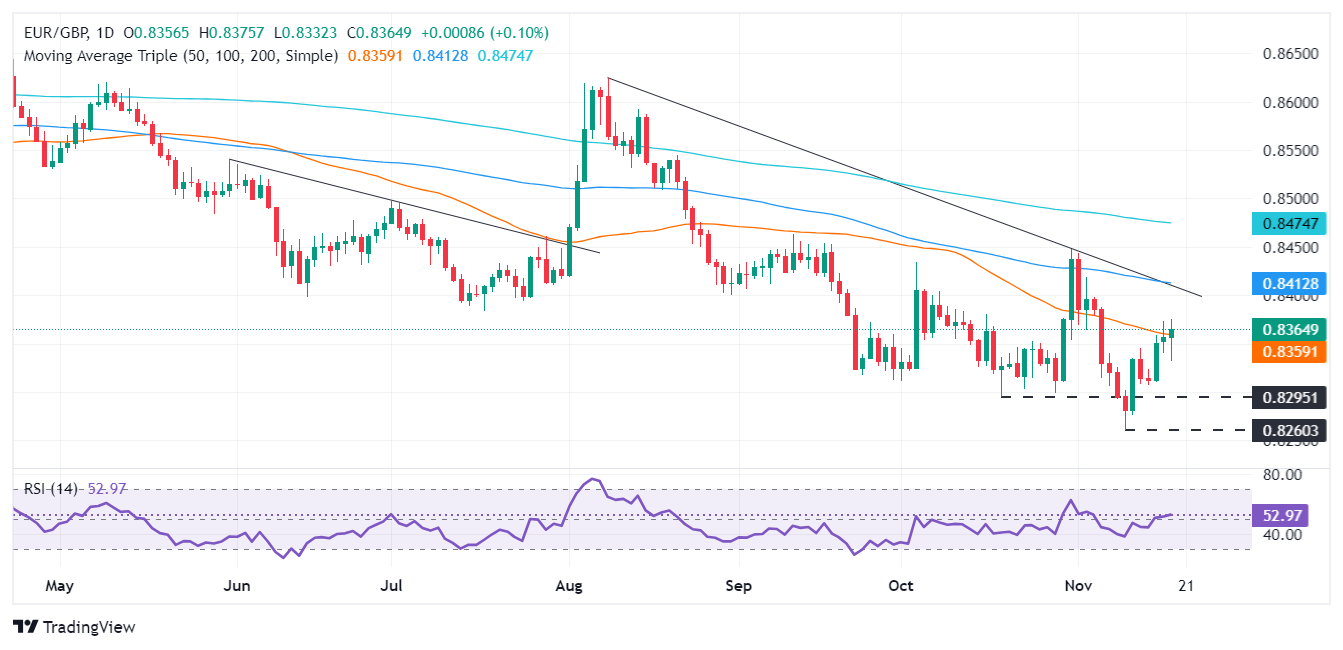
- EUR/GBP rises past the 50-day SMA of 0.8359, setting sights on the 0.8400 resistance.
- If breached, next key levels include the 100-day SMA at 0.8413, October 31 high of 0.8448.
- Downside risks remain; a dip below 0.8359 could see consolidation or a retest of the 0.8260 level.

The EUR/GBP extended its gains for the fourth straight day, edged up above the 50-day Simpl Moving Average (SMA), and was exchanging hands at 0.8373 at the time of writing.
EUR/GBP Price Forecast: Technical outlook
After hitting a year-to-date (YTD) low of 0.8260, the EUR/GBP has climbed past the 0.8300 figure, cleared on its way the 50-day Simple Moving Average (SMA) of 0.8359 and paving the way for a test of 0.8400. A breach of the latter will expose the 100-day SMA at 0.8413, followed by the October 31 swing high of 0.8448.
Conversely, if EUR/GBP slips beneath the 50-day SMA at 0.8359, the pair might consolidate within the 0.8300-0.8359 area unless sellers drive the exchange rate below the bottom of the range, which would open the door to test 0.8260.
Indicators such as the Relative Strength Index (RSI) hint buyers are in charge after turning bullish once they clear the 50 neutral line.
EUR/GBP Price Chart – Daily
Euro PRICE Today
The table below shows the percentage change of Euro (EUR) against listed major currencies today. Euro was the strongest against the British Pound.
| USD | EUR | GBP | JPY | CAD | AUD | NZD | CHF | |
|---|---|---|---|---|---|---|---|---|
| USD | 0.23% | 0.33% | -0.39% | -0.10% | 0.05% | 0.03% | -0.12% | |
| EUR | -0.23% | 0.11% | -0.57% | -0.32% | -0.19% | -0.18% | -0.35% | |
| GBP | -0.33% | -0.11% | -0.68% | -0.43% | -0.29% | -0.29% | -0.44% | |
| JPY | 0.39% | 0.57% | 0.68% | 0.28% | 0.42% | 0.40% | 0.25% | |
| CAD | 0.10% | 0.32% | 0.43% | -0.28% | 0.14% | 0.13% | -0.02% | |
| AUD | -0.05% | 0.19% | 0.29% | -0.42% | -0.14% | -0.01% | -0.16% | |
| NZD | -0.03% | 0.18% | 0.29% | -0.40% | -0.13% | 0.00% | -0.15% | |
| CHF | 0.12% | 0.35% | 0.44% | -0.25% | 0.02% | 0.16% | 0.15% |
The heat map shows percentage changes of major currencies against each other. The base currency is picked from the left column, while the quote currency is picked from the top row. For example, if you pick the Euro from the left column and move along the horizontal line to the US Dollar, the percentage change displayed in the box will represent EUR (base)/USD (quote).
Author

Christian Borjon Valencia
FXStreet
Markets analyst, news editor, and trading instructor with over 14 years of experience across FX, commodities, US equity indices, and global macro markets.