|

Elliott Wave view: S&P 500 breakout to record high confirms bullish momentum [Video]

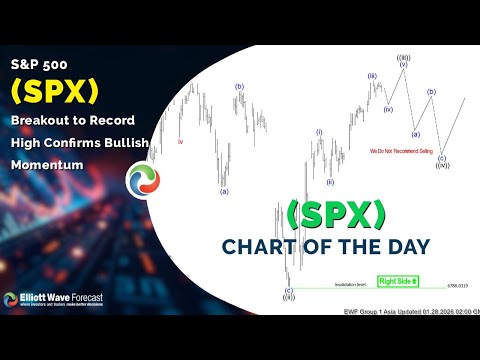
The S&P 500 (SPX) has advanced to a new all-time high, confirming that the bullish sequence from the November 21, 2025 low remains intact. This breakout favors more upside in the near term. The rally from that low is unfolding in a clear five-wave structure, consistent with Elliott Wave analysis. Wave ((i)) ended at 6986.33, marking the first leg of strength. The pullback in wave ((ii)) developed as a zigzag correction. Within this phase, wave (a) ended at 6885.74, wave (b) rallied to 6979.34, and wave (c) declined to 6788.03. This completed wave ((ii)) at a higher degree.

From there, the index resumed higher in wave ((iii)). Wave (i) advanced to 6934.75, while wave (ii) pulled back to 6895.5. Momentum carried wave (iii) to 6988.82. A short-term pullback in wave (iv) is expected, but buyers should return for one more push higher to complete wave (v) of ((iii)). Afterward, the index should correct in wave ((iv)), addressing the cycle from the January 21, 2026 low before resuming its broader rally.

Near term, as long as the pivot at 6788.03 holds, pullbacks are likely to remain corrective. Buyers are expected to appear in three, seven, or eleven swings, supporting further upside. This structure highlights market resilience and suggests that the path of least resistance continues to point higher.

S&P 500 (SPX) 45 minute chart

SPX Elliott Wave [Video]

Youtube preview

Author

Elliott Wave Forecast Team

Elliott Wave Forecast Team

ElliottWave-Forecast.com

More from Elliott Wave Forecast Team
Share:

Editor's Picks

EUR/USD weakens below 1.2000 amid rebound in US Dollar, all eyes on Fed rate decision

The EUR/USD pair attracts some sellers to near 1.1990, snapping the four-day winning streak during the early European session on Wednesday. The major pair retraces from a five-year high amid renewed US Dollar demand. All eyes will be on the US Federal Reserve interest rate decision on Wednesday. 

GBP/USD trades below 1.3800 after pulling back from four-year highs

GBP/USD depreciates after four days of gains, trading around 1.3800 during the Asian hours on Friday. The technical analysis of the daily chart suggests a potential bearish reversal amid a narrowing range, suggesting buyers are losing strength within the rising wedge pattern.

Gold record-setting rally extends ahead of Fed decision

Gold is continuing its record-printing spree early Wednesday, testing offers above the $5,200 level for the first time. Buyers refuse to pause heading into the US Federal Reserve policy announcements, due later in the day.

Bitcoin, Ethereum and Ripple extend recovery after retesting key supports

Bitcoin, Ethereum, and Ripple are extending their recovery so far this week after a massive correction last week. BTC trades above $89,000, ETH above $3,000 and XRP above $1.90.

Four problems of the US Dollar

The US Dollar Index returned to last year's lower bound, which we had not seen since 2022. The drivers are investment portfolio diversification, concerns about the US economic growth slowdown, rumours of FX interventions and active selling by carry-traders.

XRP price struggles below $2.00 despite steady ETF demand

Ripple (XRP) is trading around $1.88 at the time of writing on Tuesday, correcting from the previous day’s high of $1.95. The cross-border remittance token remains under immense pressure amid a weak technical structure.