|

Elliott Wave view: Microsoft (MSFT) Entering 3‑Wave correction after impulse

Microsoft (MSFT) established a major all-time high on July 31, 2025, at $555.45. Afterward, the stock entered a significant correction that concluded on March 28, 2026, at $356.07. This decline has been classified as wave (II). Since then, the stock has advanced in wave (III). However, it must still climb above the prior peak at $555.45 to eliminate the risk of a double correction. The rally from the wave (II) low unfolded as a five-wave Elliott Wave impulse, which strengthens the probability of continued upside while prices remain above that level.

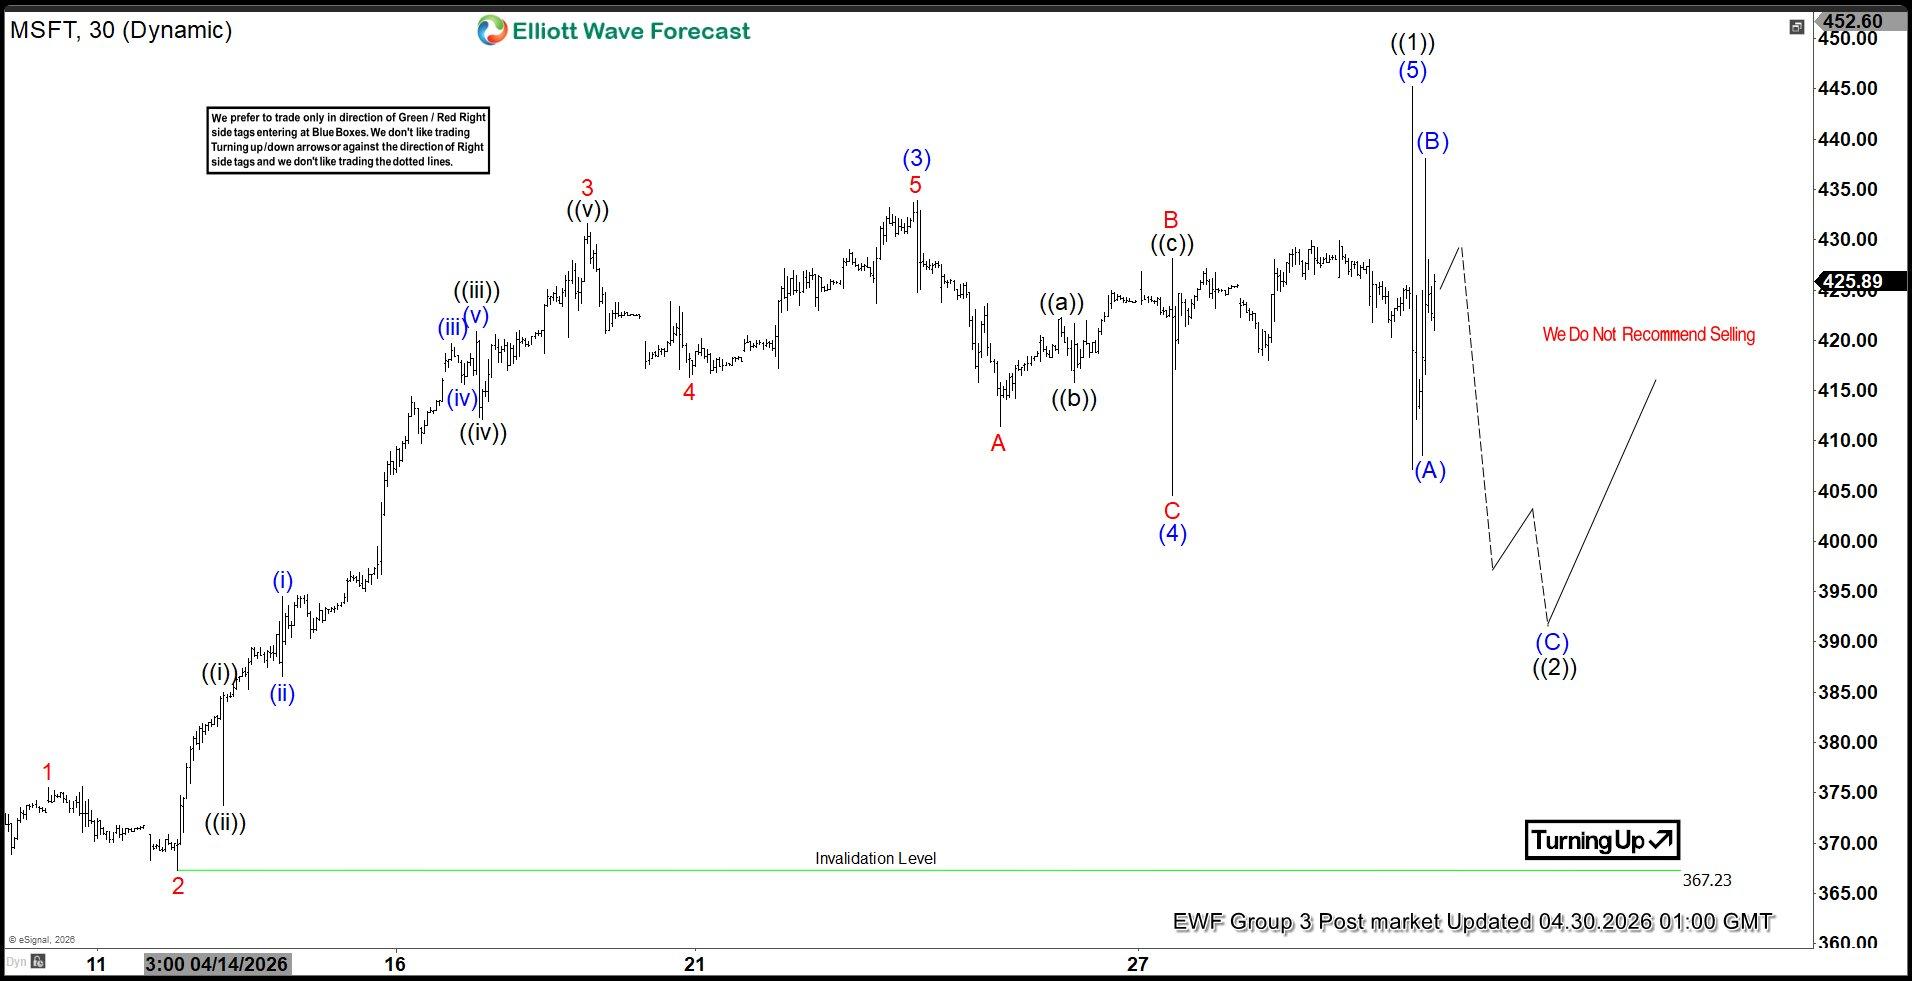
From the wave (II) low, wave (1) ended at $386.29, followed by a pullback in wave (2) that terminated at $367.05. The stock then extended higher in wave (3), reaching $433.94, as shown on the thirty-minute chart. A subsequent pullback in wave (4) concluded at $404.61. The final advance in wave (5) ended at $445.24, completing wave ((1)). At present, a pullback in wave ((2)) is unfolding to correct the cycle from the March 28, 2026 low. This correction is expected to develop in either three or seven swings before the rally resumes. In the near term, as long as the pivot at $367.23 remains intact, dips should attract buyers in three or seven swings, supporting the case for further upside.

Microsoft (MSFT) 30-Minute Elliott Wave Chart

MSFT Elliott Wave Video:

Youtube preview

Author

Elliott Wave Forecast Team

Elliott Wave Forecast Team

ElliottWave-Forecast.com

More from Elliott Wave Forecast Team
Share:

Editor's Picks

GBP/USD bulls seem hesitant as Hormuz ship attack supports safe-haven USD

The GBP/USD pair sticks to a positive bias for the second straight day, albeit it remains below the previous day's swing high and trades just below the 1.3200 mark during the Asian session on Friday. Furthermore, the fundamental backdrop warrants caution before positioning for any meaningful recovery from November 2025 lows, around the 1.3140 region, touched on Wednesday.

EUR/USD holds above mid-1.1300s amid Hormuz risks, bearish setup

The EUR/USD pair struggles to capitalize on the previous day's modest recovery gains and oscillates in a narrow band during the Asian session. Spot prices, however, hold above mid-1.1300s and the lowest level since May 2025, set on Thursday, warranting some caution for bearish traders.

Gold recovers early lost ground; bearish bias remains amid Fed hike bets

Gold builds on its modest intraday bounce from the $3,983-$3982 region, and climbs to the top end of its daily range heading into the European session. The US Dollar remains depressed below its highest level since May 2025 set on Thursday, amid receding Federal Reserve rate-hike bets. This is seen as a key factor lending some support to the commodity.

Ripple price clings to $1 as long liquidations deepen bearish trend

Ripple (XRP) trades near the key psychological support level of $1 after losing more than 8% so far this week. CoinGlass liquidation data shows that over 97% XRP long positions were wiped out over the past 24 hours. In addition, derivatives metrics continue to favor the bears.

Asian stock markets plummet as Apple price hike raises inflation concerns, KOSPI dives over 8%
Asian equity markets on Friday are significantly down as price hikes announced by Apple Inc. due to memory chip shortages have prompted fears of high inflation globally and concerns on earning projections of various companies that rely on these sophisticated chips for their final products.
Regime change: Inside Kevin Warsh's first move to make the Fed unreadable on purpose

The rate did not move. That was the least interesting thing about Kevin Warsh's first meeting in charge of the Fed. The FOMC held its benchmark at 3.50%-3.75% for the fourth straight meeting, exactly as priced, and then the new chair used his first press conference to dismantle the machinery the market has leaned on for a decade.