Elliott Wave and market breadth align on late-stage rally risk for the S&P 500

Since April 1, we have tracked a potential rebound within the April 18–28 window, using a blend of Elliott Wave analysis, market breadth, and seasonality.
Our initial upside target was $6,800–6,900, based on a typical 61.8%–76.4% Fibonacci retracement of the prior decline and nearby support/resistance. When the index surged above that zone in early April, the strength of the move shifted focus to $7,120 into the mid-term election year’s average turn date around April 18 (±5 trading days). For this year, the seasonal pattern had played out about 75% of the time. See Figure 1.
Figure 1. Mid-Term Election Year Seasonality
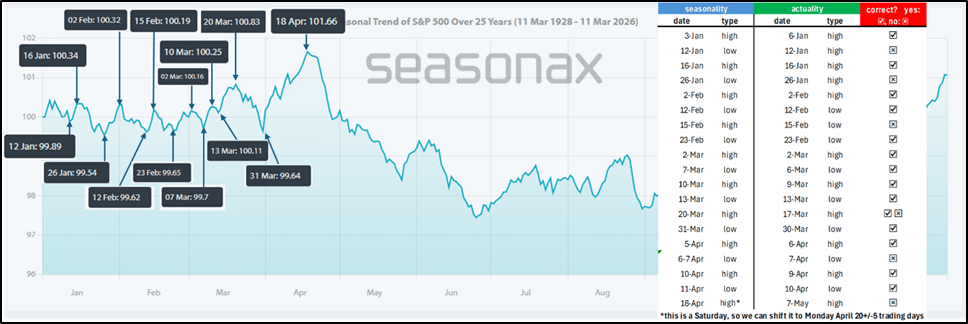
Now that the April 18 window has closed and the index ignored it, we want to remind everyone that in the stock market, “60% of the time, it works every time,” or “past performance is no guarantee of future results.” Thus, even a 75% track record does not justify complacency. No, we must always “anticipate, monitor, and adjust, if necessary,” as that is all we can do in a stochastic, probabilistic environment like the stock market. Such flexibility helps us navigate ever-changing conditions more easily and profitably.
However, all hope is not yet lost for the bears as the index appears to be running out of steam two weeks later than expected. See our Elliott Wave Principle work in Figure 2.
Figure 2. Short-term Elliott Wave count with technical indicators for the SP500
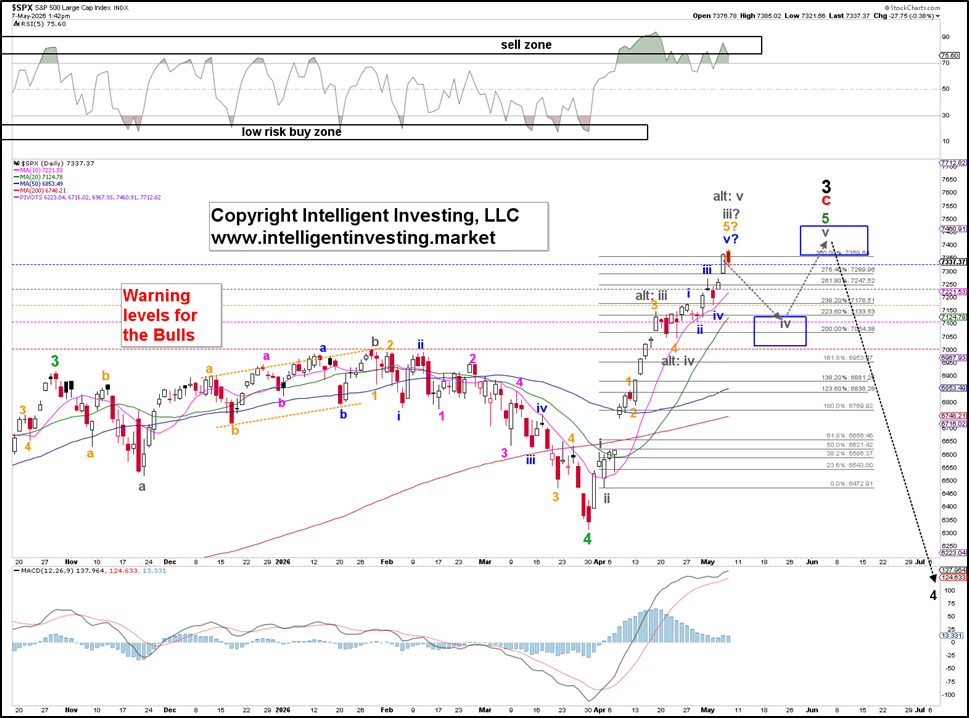
Namely, as we stated in our previous update, “… we [can] count the March low as a fourth wave, with a fifth wave underway, as indicated by the green “alt: 4, alt: 5” labels. Also, the fifth wave, …, is a terminal wave.” Based on price action since April 17, we have updated to this EWP count. It allows for one last, smaller (gray) 4th and 5th wave to complete the major (black) 3rd wave, but that is no longer necessary. The major 4th wave ideally targets $6,100 +/- 200.
One of the biggest mistakes in financial market analysis is looking for a single narrative. But stock markets are layered. Ignore one layer, and one’s reading is incomplete. Stack them together, and things start to make sense. This is why we use the weight-of-the-evidence approach, which is grounded in science. We do not rely solely on
· Elliott wave analysis: Subjective counts can lead to inconsistent, hindsight-biased predictions.
· Seasonality and cycles: Patterns weaken or vanish as conditions change.
· Market breadth: Often lags, can produce false positives, and unresolved divergences can mislead.
· Sentiment: Extremes persist unpredictably; timing remains unreliable.
· Historical studies: Data mining bias and non-stationary regimes distort.
We are among the very few who combine all methods within a cross-validation framework, thereby offsetting individual flaws, reducing false signals, and yielding more reliable forward-return estimates.
Here we show the cumulative advancing issues (stocks) vs. declining issues and the A/D line for the S&P 500, and find that the A/D line has been diverging negatively since April 20. See the red and green dotted arrows in Figure 3.
Figure 2. Cumulative A/D line for the SP500
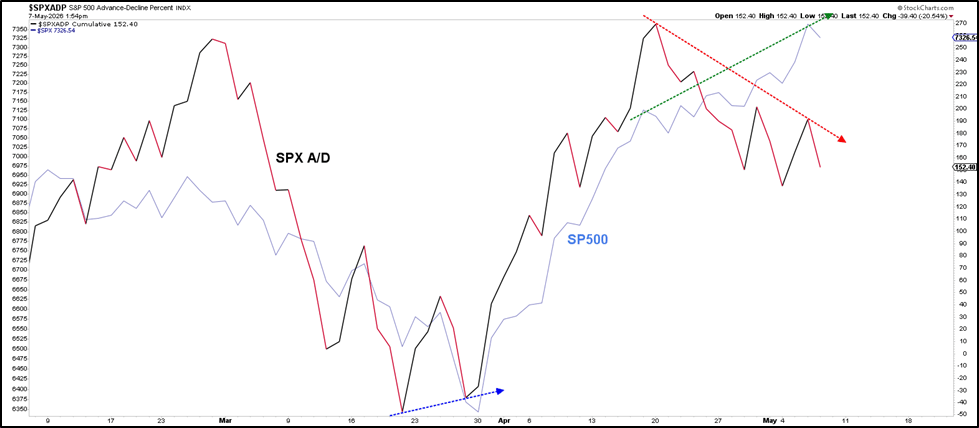
Thus, fewer stocks have participated in the recent rally. This is the opposite of what we showed on April 1, when fewer stocks were participating in the decline (blue dotted arrow). Back then, the EWP count and market breadth aligned, so we were looking for much higher prices.
Now, market breadth and the EWP are aligning again, as we are seeing signs of exhaustion, typical of a terminal 5th wave. This is exactly what we concluded last time: “… we continue to monitor for signs of exhaustion and/or a reversal for our premium members, as we did at the end of March, because such signs will be essential for managing risk and capitalizing on potential trend shifts.”
Although market breadth divergence is a condition rather than a trade trigger, we need to issue an update because the index may be on the cusp of a >1000p decline.
Author

Dr. Arnout Ter Schure
Intelligent Investing, LLC
After having worked for over ten years within the field of energy and the environment, Dr.