Eli Lilly and Company (LLY) forecast: Bulls watching the $1074–$1003 support zone

Eli Lilly & Company (LLY) discovers, develops & markets human pharmaceuticals worldwide. It comes under Healthcare sector & trades as “LLY” ticket at NYSE.
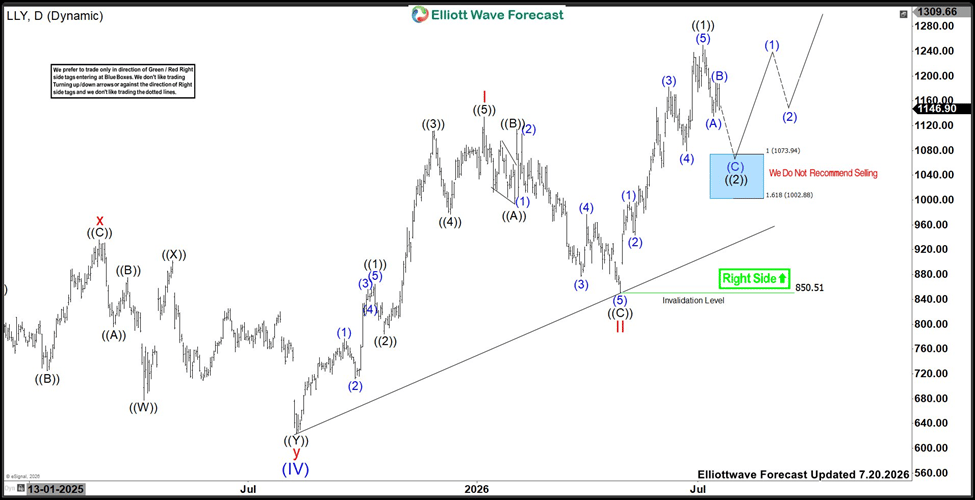
The LLY favors corrective pullback in ((2)) against 4.29.2026 low before continue rally in bull sequence of III. The buyers should look for next opportunity between $1073.94 – $1002.88 area to extend in ((3)).
LLY – Elliott Wave latest daily view
In weekly, it favors bullish impulse sequence as trading to ATH. It placed (II) at $64.18 low in November-2016, (III) at $937.96 high in August-2024 & (IV) at $623.78 low in August-2025 low. Within (III), it placed I at $129.48 high, II at $101.36 low, III at $966.10 high, IV at $775.81 low & V at $937.96 high. The wave III of (III) was extended nested wave showing highest momentum. The (IV) pullback was double correction. It placed w at $711.40 low, x at $935.63 high & y at $623.78 low. Each degree further subdivided in 3 or 7 swings. Above $623.78 low, it placed ((1)) of I at $776.96 high, ((2)) at $712.05 low, ((3)) at $1111.99 high, ((4)) at $977.12 low & ((5)) at $1133.95 high.
LLY – Elliott Wave view from 6.10.2026
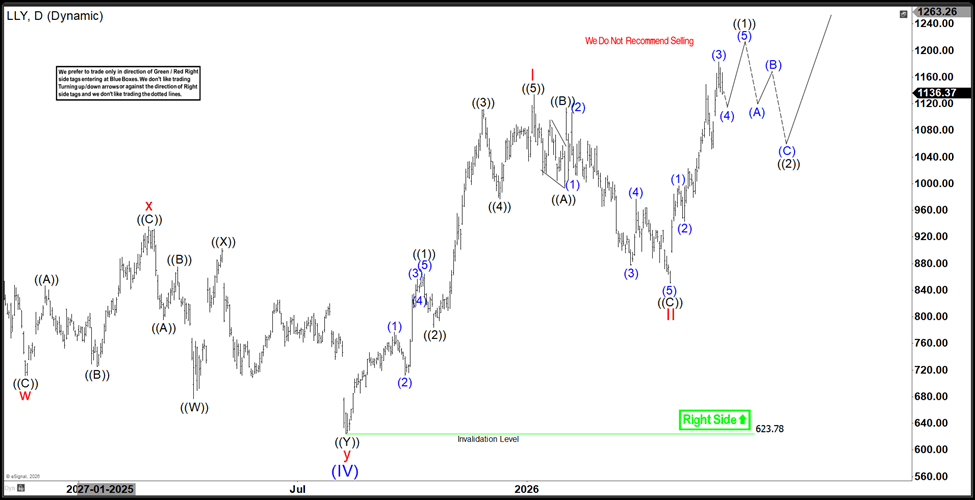
It ended II in extended zigzag correction, where ((A)) at $993.58 low, ((B)) at $1114 high & ((C)) at $850.51 low. It already ended ((1)) of III at $1249.45 high against 4.29.2026 low & favors pullback in ((2)). Within ((1)), it ended (1) at $996.49 high, (2) at $943.26 low, (3) at $1182.73 high, 1079.22 low & (5) at $1249.45 high. Within ((2)) pullback, it ended (A) at $1134.40 low & appears ended (B) at $1189.07 high. Below there, it expects downside into $1073.94 – $1002.88 area to finish ((2)), which confirms below $1134.40 low. But if it breaks above $1189.07 high, it can do double in (B) in alternate view before turning lower. We like to buy the pullback in extreme area in (C) against April-2026 low for next rally above $1362 or higher.
LLY – Elliott Wave latest weekly view
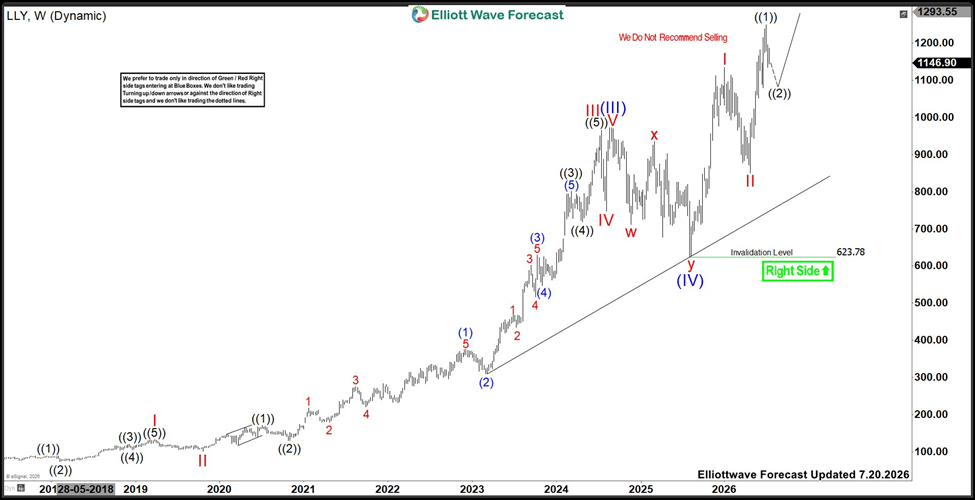
Further rally in ((3)) will confirm when it manages to erase the momentum divergence after breaking above July-2026 peak. Alternatively, it can do diagonal in I sequence with new high from August-2025 high before correcting lower in II, which later break below current pullback low. In either the case, buyers can look for buy in clear 3, 7 or 11 swings pullback at extreme area.
Author

Elliott Wave Forecast Team
ElliottWave-Forecast.com

















