|

Eli Lilly and company (LLY) forecast: Bullish Wave ((3)) targets $1571 – $1755

Eli Lilly & Company (LLY) discovers, develops & markets human pharmaceuticals worldwide. It comes under Healthcare sector & trades as “LLY” ticket at NYSE.

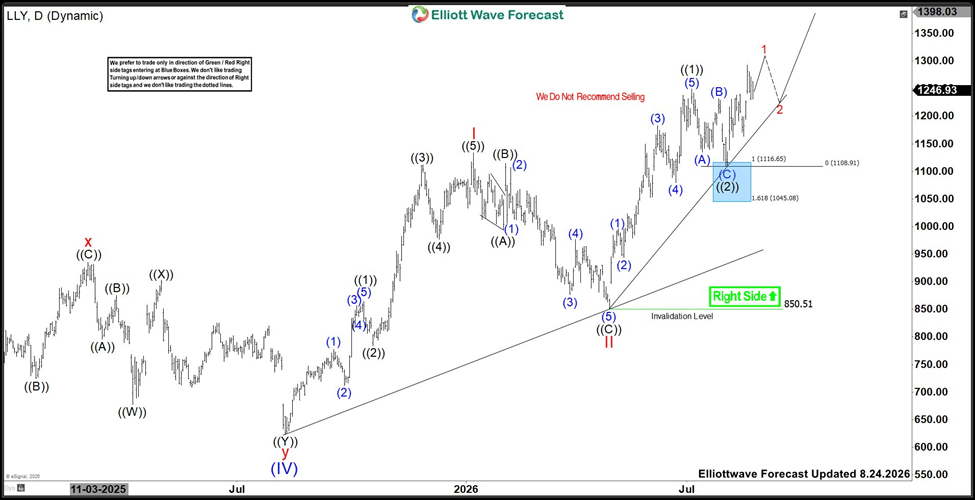
The LLY favors rally in ((3)) of III in impulse sequence against April-2026 low against 8.03.2026 low. The buyers should remain long from the daily blue box area targeting $1570.95 – $1754.56 area.

LLY – Elliott Wave latest daily view
Chart

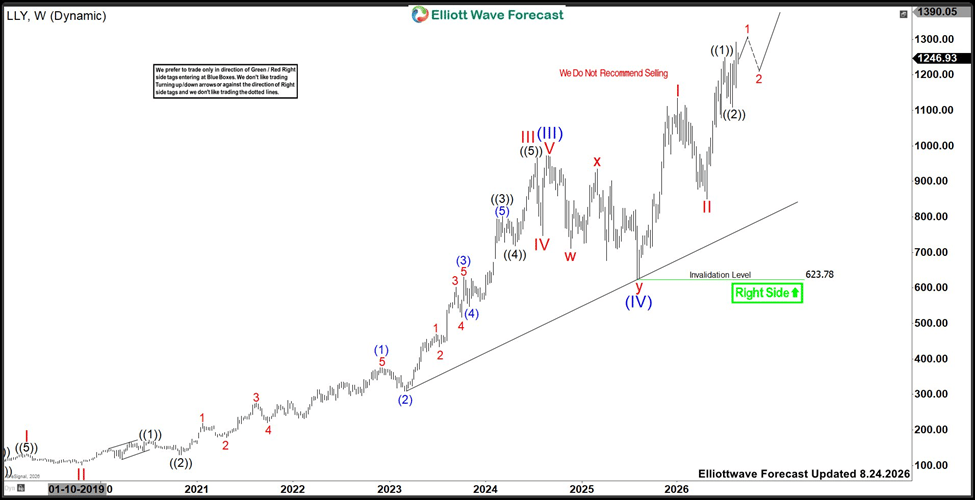
In weekly, it favors bullish impulse sequence to ATH. It placed (II) at $64.18 low in November-2016, (III) at $937.96 high in August-2024 & (IV) at $623.78 low in August-2025 low. Above (IV) low, it ended I of (V) at $1133.95 high (January-2026) & II as zigzag at $850.51 low (April-2026). Within I, it ended ((1)) at $864.35 high, ((2)) at $783.85 low, ((3)) at $1111.99 high, ((4)) at $977.12 low & ((5)) at $1133.95 high. Below I high, it ended ((A)) at $993.58 low, ((B)) at $1114 high & ((C)) as extended leg at $850.51 low.

LLY – Elliott Wave view from early August-2026
Chart

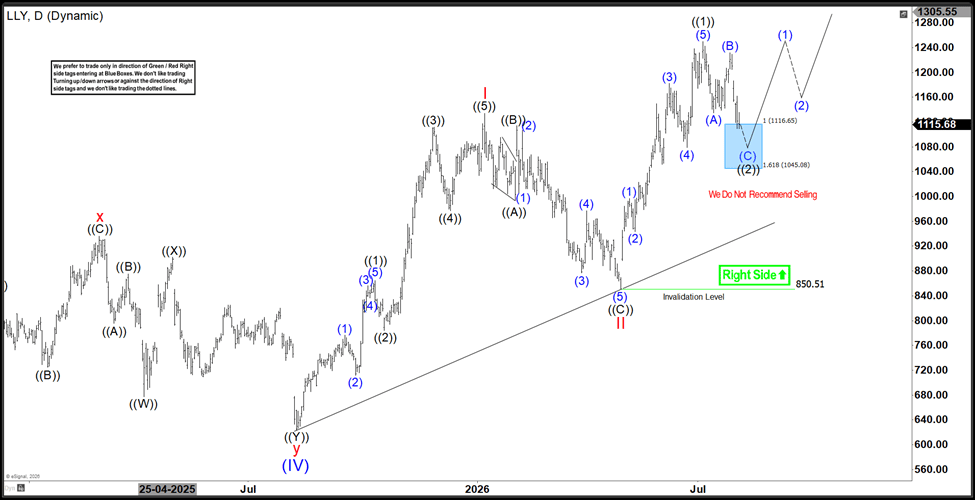
It ended ((1)) of III at $1249.45 high & ((2)) at $1109.15 low in blue box area as anticipated. Within ((1)), it ended (1) at $$99.49 high, (2) at $943.26 low, (3) at $1182.73 high, (4) at $1079.22 low & (5) at $1249.45 low. It ended (A) of ((2)) at $1134.40 low, (B) at $1232 high & ((C)) at $1109.15 low. Currently, it favors rally in 1 of (1) of ((3)). The ((3)) should extend towards $1570.95 – $1754.56 area, while dips remain above 8.03.2026 low. Alternatively, it can break below 8.03.2026 low, without extending higher to be flat in ((2)) to correct against 4.29.2026 low before resume higher in ((3)). We recommend buying extremes in 3, 7 or 11 swings against August-2026 low.

LLY – Elliott Wave latest weekly view
Chart

Author

Elliott Wave Forecast Team

Elliott Wave Forecast Team

ElliottWave-Forecast.com

More from Elliott Wave Forecast Team
Share:

Editor's Picks

GBP/USD remains stuck in tight range above 1.3600

GBP/USD extends its consolidation into a second consecutive day on Tuesday and fluctuates in a narrow band above 1.3600. The US Dollar stabilizes as investors assess US sanctions on Iran, while diplomatic efforts creep back amid reports that Pakistan is carrying an offer to Iran to halt the siege and lift sanctions under the Memorandum of Understanding.

EUR/USD stays below 1.1700 after weak US consumer confidence data

EUR/USD struggles to gather recovery momentum and trades below 1.1700 in the second half of the day on Tuesday. The US Dollar (USD) benefits from the cautious mood as investors assess the latest developments in the Middle East. Meanwhile, disappointing consumer sentiment data from the US helps the pair hold its ground.

Gold takes a breather after climbing to a fresh three-month high, US PCE in focus

Gold (XAU/USD) extends its intraday decline during American trading hours on Tuesday after setting a fresh three-month high of $4,697 earlier in the day.

Crypto Today: Bitcoin soars past $80K as Ethereum and XRP hold gains

Bitcoin (BTC) is trading above $80,000 on Tuesday. This is the highest level the Crypto King has traded since mid-May, underscoring a positive shift in investors' risk-on sentiment, liquidity conditions and the technical outlook.

Nvidia earnings: A quick look at expectations

The 2026 Q2 earnings season is nearly over for S&P 500 members, with the reporting cycle notably positive. But looming large this week is none other than AI-favorite NVIDIA (NVDA) , whose results will wrap up the reporting cycle for the Magnificent Seven group as well.

$20 billion offered, $2 billion taken: Why Treasury doubled its buyback cap

The US Treasury moved off its own calendar on Wednesday, and that is the part worth sitting with. At 12:32 GMT, the department said it would at least double the size of liquidity support buyback operations in the 10-year to 20-year and 20-year to 30-year sectors, lifting the maximum from $2 billion per operation to at least $4 billion, effective September 9 and running to November 4.















