Dow Jones Industrial Average takes Pakistan's word for it
- DJIA rose 0.6% on Friday, leading the US majors higher on peace deal optimism and a consumer sentiment beat.
- The US and Iran are publicly disputing the contents of the draft MOU, with no official final text released by either side.
- Rate markets treat next week's Fed hold as a formality and now favor a first hike by December.

The Dow Jones Industrial Average (DJIA) climbed 0.6% on Friday, settling near 51,200 and outperforming the rest of the US majors on a day when the tech-heavy Nasdaq Composite slipped into the red. The bid rests on a peace deal that exists mostly as a social media post: Pakistani Prime Minister Shehbaz Sharif announced a final agreed text, Iranian state media described its own set of terms, and neither principal has confirmed anything.
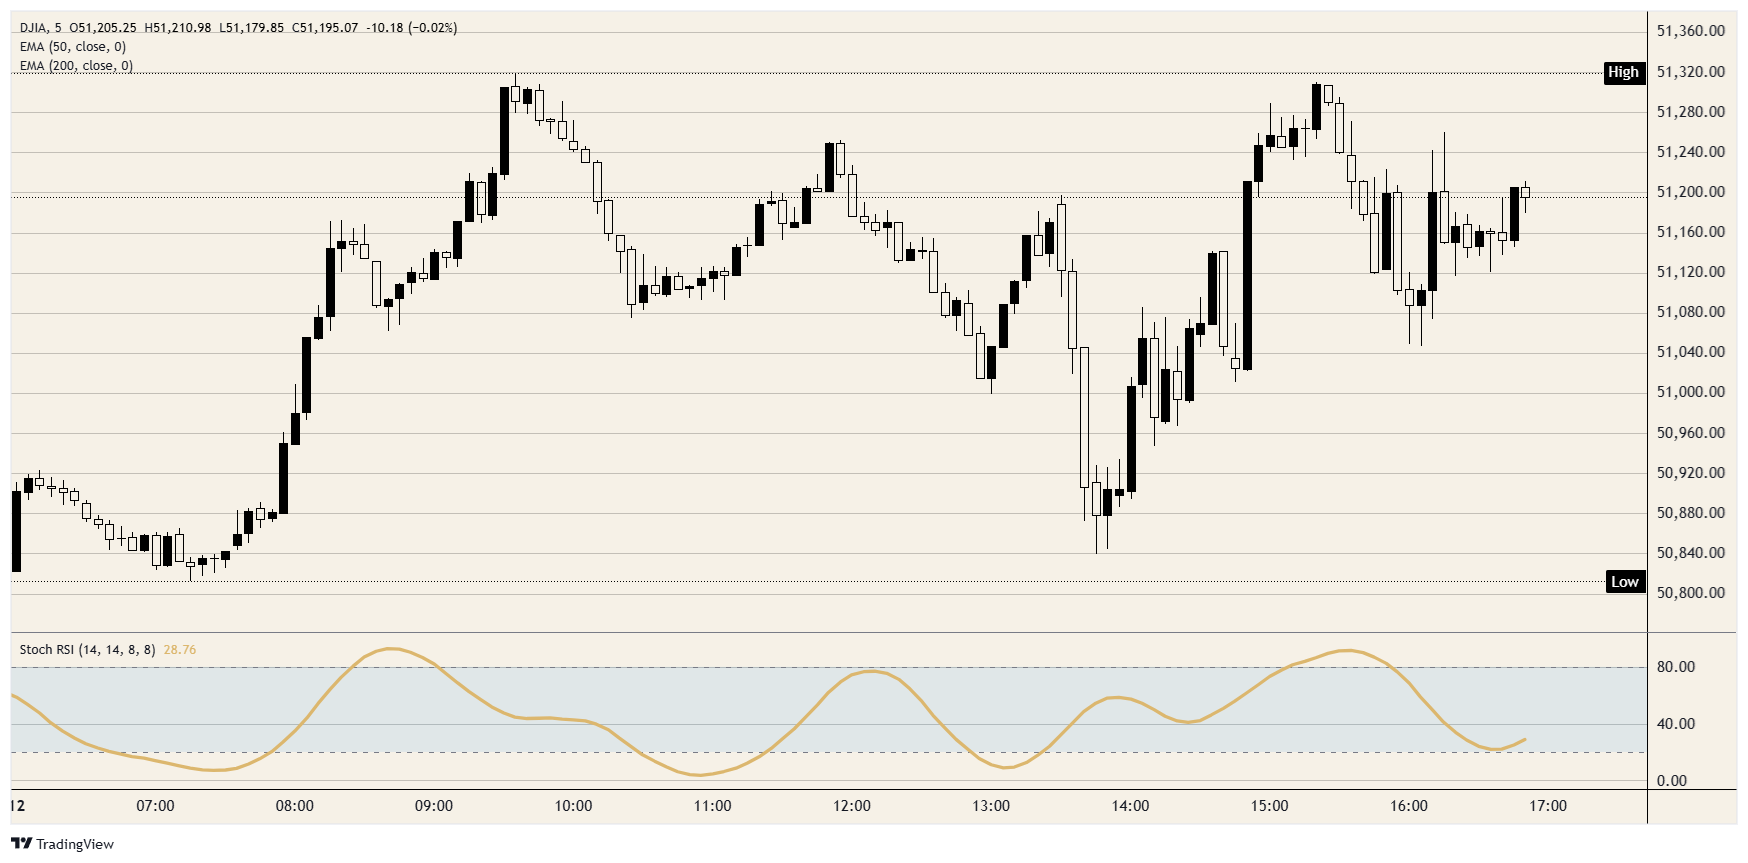
The Dow clocked in just above 50,800 in the opening hour of a session that traded headlines over fundamentals, then ran to a mid-morning peak close to 51,300. A midday flush followed after US President Donald Trump took to Truth Social to warn Tehran over its conduct, dragging the benchmark back toward the session low. Upbeat sentiment data at 14:00 GMT and renewed signing chatter hauled it back toward the highs before a late fade into the close.
A final text, depending on who you ask
Sharif's post on X claimed negotiators had locked down the text of the agreement and dismissed contrary reporting as a coordinated misinformation campaign, a striking level of confidence for an unpublished document. Iranian state media filled the vacuum with a version of the memorandum of understanding (MOU) that commits the US to lifting sanctions on Iranian Crude Oil exports while Iran reopens the Strait of Hormuz. Fuller accounts circulating in Tehran add a US troop withdrawal and a reconstruction commitment worth $300 billion or more, neither of which Washington has acknowledged.
The American side is hardly steadier, with Trump flatly denying Tehran's account of the terms on Friday after a fresh drone attack, even while floating a Geneva signing as soon as this weekend. Iran's Foreign Ministry has blamed contradictory US positions for disrupting the process and pushed back on the weekend timeline, and Trump has declared a deal imminent repeatedly across the four-month conflict. West Texas Intermediate (WTI) Crude Oil futures still fell about 3% to trade around $84 a barrel, suggesting energy desks are pricing Hormuz relief first and asking for verification later.
A trillionaire premiere steals the tech bid
The day's other spectacle was SpaceX, which priced its initial public offering (IPO) at $135, opened at $150 on the Nasdaq under SPCX and ran more than 20% higher, minting Elon Musk as the world's first trillionaire. Capital chasing the debut left megacap tech mixed and the Nasdaq Composite down 0.1%, while the Dow's old-economy roster quietly took the lead.
Michigan hands the Fed its talking point
University of Michigan (UoM) consumer sentiment printed 48.9 in the preliminary June read against a consensus of 46, a beat that still leaves absolute levels historically depressed. The detail that matters sat in the inflation components, where 1-year expectations eased to 4.6% from 4.8%, and the 5-year measure fell to 3.4% from 3.9%.
With the Consumer Price Index (CPI) still running at 4.2% YoY, cooling expectations hand the Federal Reserve (Fed) cover for next Wednesday's hold at 3.50% to 3.75%, which CME FedWatch prices above 96%. The live question is when the next move lands, and rate markets point up rather than down: hike odds run near 30% by September, close to 40% in October, and tip toward 60% by the December meeting, where a single step to 3.75% to 4.00% screens as the most likely outcome.
One preliminary survey does not unwind a 4-handle CPI, but equities traded Friday as though it might. Wednesday's refreshed rate projections will show whether the Fed is prepared to validate that pricing or lean against it.
Levels and bias
Resistance: The 51,300 area capped the index twice, first at the mid-morning high and again on the afternoon recovery. Acceptance above that zone would mark the peace trade graduating from rumor to conviction, a hard case to make before a signature actually exists.
Support: Initial demand sits at the 51,000 mark, though the zone that matters runs from roughly 50,800 to 50,850, defended once in the opening hour and again during the midday flush. A weekend without a signature puts that floor straight back in play.
Bias: Constructive while the index holds above 51,000, with momentum reset after the late pullback and the Stochastic Relative Strength Index (Stoch RSI) finishing just below 30 on the 5-minute chart. Monday's open belongs to whatever happens, or fails to happen, in Geneva; gap risk cuts both ways and sizing should respect it.
Dow Jones 5-minute chart
Dow Jones FAQs
The Dow Jones Industrial Average, one of the oldest stock market indices in the world, is compiled of the 30 most traded stocks in the US. The index is price-weighted rather than weighted by capitalization. It is calculated by summing the prices of the constituent stocks and dividing them by a factor, currently 0.152. The index was founded by Charles Dow, who also founded the Wall Street Journal. In later years it has been criticized for not being broadly representative enough because it only tracks 30 conglomerates, unlike broader indices such as the S&P 500.
Many different factors drive the Dow Jones Industrial Average (DJIA). The aggregate performance of the component companies revealed in quarterly company earnings reports is the main one. US and global macroeconomic data also contributes as it impacts on investor sentiment. The level of interest rates, set by the Federal Reserve (Fed), also influences the DJIA as it affects the cost of credit, on which many corporations are heavily reliant. Therefore, inflation can be a major driver as well as other metrics which impact the Fed decisions.
Dow Theory is a method for identifying the primary trend of the stock market developed by Charles Dow. A key step is to compare the direction of the Dow Jones Industrial Average (DJIA) and the Dow Jones Transportation Average (DJTA) and only follow trends where both are moving in the same direction. Volume is a confirmatory criteria. The theory uses elements of peak and trough analysis. Dow’s theory posits three trend phases: accumulation, when smart money starts buying or selling; public participation, when the wider public joins in; and distribution, when the smart money exits.
There are a number of ways to trade the DJIA. One is to use ETFs which allow investors to trade the DJIA as a single security, rather than having to buy shares in all 30 constituent companies. A leading example is the SPDR Dow Jones Industrial Average ETF (DIA). DJIA futures contracts enable traders to speculate on the future value of the index and Options provide the right, but not the obligation, to buy or sell the index at a predetermined price in the future. Mutual funds enable investors to buy a share of a diversified portfolio of DJIA stocks thus providing exposure to the overall index.
Author

Joshua Gibson
FXStreet
Joshua joins the FXStreet team as an Economics and Finance double major from Vancouver Island University with twelve years' experience as an independent trader focusing on technical analysis.