Dow Jones Industrial Average stumbles as bond vigilantes line up to test Warsh
- Equities broadly declined as long-end Treasury yields climbed to their highest in nearly two decades.
- Chip stocks led the breather, with the semiconductor complex down more than 7% over three sessions ahead of Nvidia's earnings after Wednesday's close.
- Oil eased after President Trump called off planned strikes on Iran, but the relief failed to translate into any reprieve for the bond market.

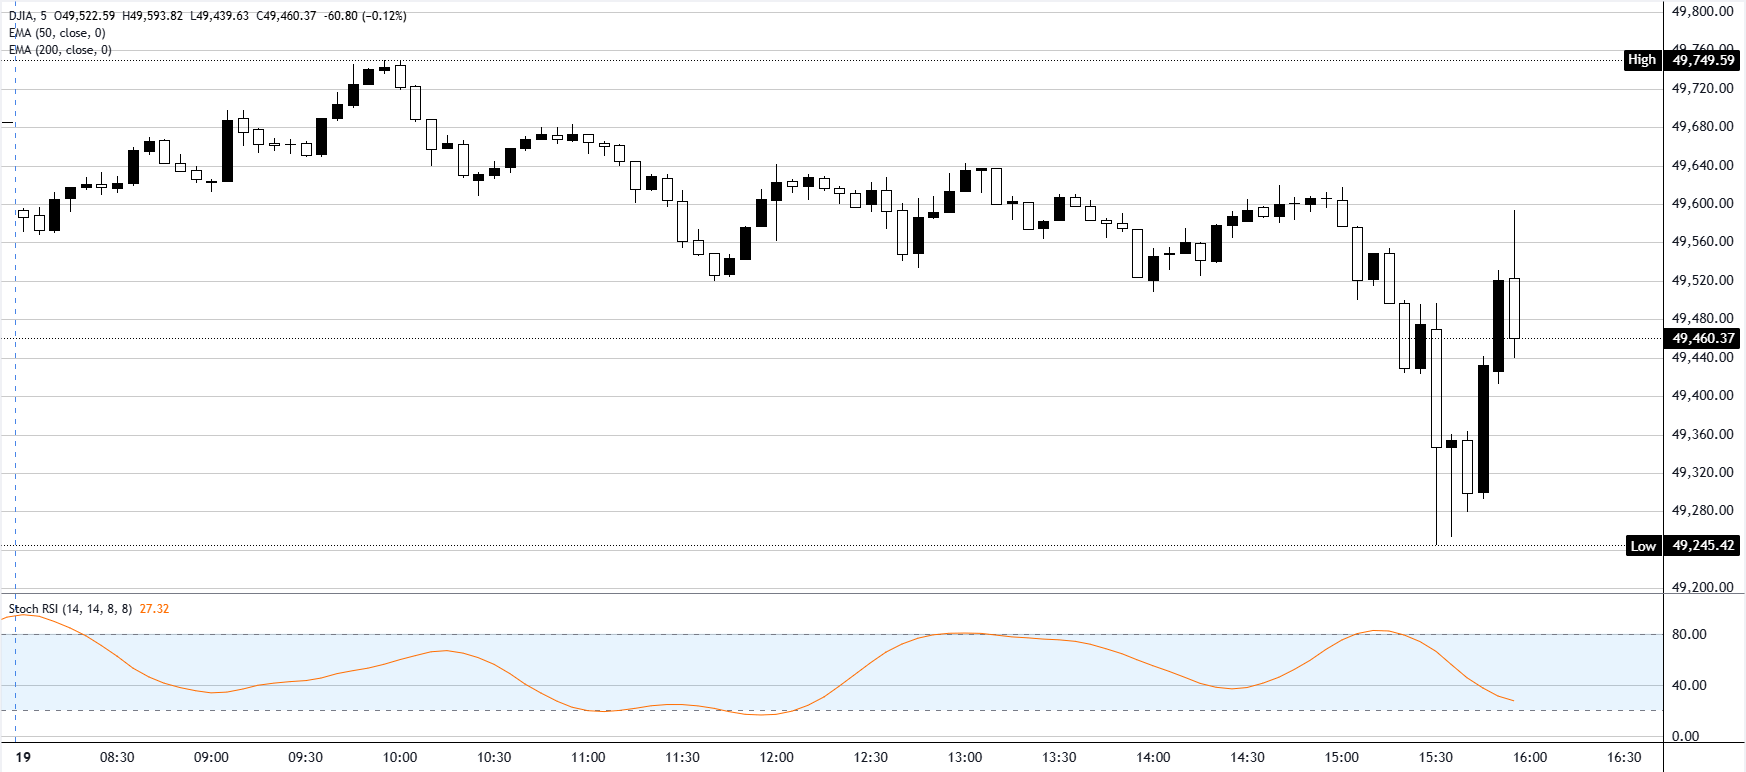
The Dow gave up a chunk of last week's record run on Tuesday, sliding back from the 50K handle it had briefly tagged days earlier, with the broader equity tape leaning lower as bonds did the heavy lifting on the downside. Futures opened the session with a tentative bid after Trump's overnight reversal on Iran, but the relief was short-lived once cash trading exposed the real story. The 30-year Treasury yield punched above 5.18%, a level not seen in nearly nineteen years, and the move came on a day when Oil was actually falling. That decoupling is the interesting part. If the inflation story were really just an Iran premium on crude, bonds should have caught a bid the moment Trump called off the strikes. They didn't. The bond market is telling you the inflation impulse is more structural than the headlines suggest, and that the Federal Reserve (Fed) is starting to look behind the curve.
Bond vigilantes pick their moment
Kevin Warsh is sworn in as Fed Chair on Friday, and the institutional view making the rounds is that the long-end selloff is the bond market warming up to test him. New chairs traditionally get a credibility audit from rates desks in their first weeks, and traders appear to be pricing the idea that a Warsh-led Fed will either need to talk tougher on inflation or wear the consequences in yields. Either way, equities sit awkwardly in the middle. Higher mortgage and credit card rates squeeze the consumer story, and higher discount rates take a bite out of the long-duration growth names that have done most of the index's heavy lifting through the rally.
Chips take a breather right on cue
The Philadelphia Semiconductor Index (SOX) dropped 1.4% on Tuesday and is now off more than 7% over three sessions. Nvidia, which prints fiscal Q1 numbers after Wednesday's close, fell for a third straight day. Qualcomm shed more than 3% and Broadcom pulled back close to 2%. The timing is striking. Investors trimming the most stretched names in the market just hours before the most important earnings print of the cycle suggests positioning is being lightened rather than reset, with most of the pain concentrated in the stocks that had run furthest. Whether Nvidia's guidance can re-light the fuse on Thursday's open is the question that matters more than the print itself.
Oil's quiet retreat tells its own story
West Texas Intermediate (WTI) slipped toward $104 and Brent dipped under $111 after Trump's overnight reversal on Iran. The de-escalation is real, but the price reaction has been muted. That fits the broader rates narrative: if Oil were the dominant inflation channel, then bonds and crude would be moving in lockstep. They aren't. The energy complex is unwinding a geopolitical premium while the rates market is pricing something stickier underneath. Markets are running two different stories at once, and the bond version is the one equities are listening to.
Thursday's PMIs, then Warsh on Friday
Thursday delivers flash S&P Global Purchasing Managers Index (PMI) prints for May, with manufacturing and services both tagged high-impact. Consensus has manufacturing at 54 and services at 51, leaving little margin for an upside surprise to add more fuel to the inflation worry already gripping the long end. A hot services print would land especially badly. Friday closes the week with Warsh's swearing-in and the second look at University of Michigan (UoM) inflation expectations, where one-year sits at 4.5% and five-year at 3.4%. Both are uncomfortable readings for a brand-new Fed Chair walking into his first set of meetings. If the bond vigilantes are setting up a welcome party, those two prints are where they'll likely bring the cake.
Dow Jones 15-minute chart
Futures FAQs
The futures market is an exchange-based auction in which participants buy and sell contracts of an underlying asset at a predetermined future date and price. The set price is agreed upon today and is derived from the underlying asset. Futures contracts can be based on a wide range of assets, with commodities among the most popular, although currencies and indices are other common underlying assets. Futures prices depend on their underlying asset and act as a mechanism for firms, institutions, and large-position traders to manage risks through hedging.
Futures can be traded in different ways. The most common ways are via a regulated exchange or via Contracts For Difference (CFDs). In the former, liquidity is high and pricing is more transparent, with the broker serving only as an intermediary between you and the market. Still, it generally requires more capital. The largest futures exchanges are the Chicago Mercantile Exchange (CME) and the New York Mercantile Exchange (NYME). As for CFDs, these require less capital and thus trading is more flexible, but at the cost of less transparency.
The E-mini S&P 500 index, Crude Oil (Brent, WTI), Natural Gas, Gold, Silver, Copper, and soft commodities such as grains are among the most actively traded contracts. These offer strong liquidity and are closely followed by traders worldwide. Futures market volume consistently exceeds spot market volume, often significantly. This dominance is driven by leverage, hedging, and higher liquidity on exchanges.
Yes. Future gauges, particularly equity index futures such as those of the S&P 500 or the Nasdaq, are widely considered key gauges of market sentiment because they reflect investors’ expectations for the next session’s opening price. When equity futures drop, it is a sign of risk-aversion, signaling bearish market sentiment. On the contrary, rising equity futures suggest markets are risk on.
As a futures contract approaches its maturity date, the futures price converges upon the spot price, becoming almost identical at expiration. However, prices can diverge significantly before the contract ends. A market is in contango when future prices are higher than spot prices, while the mirror image is called backwardation (when current prices are higher than future prices). For commodities, the normal state of the market is contango because holding the asset over time incurs costs such as storage or insurance fees. When markets turn from contango to backwardation – or vice versa – it signals a shift in the trend: a change from contango to backwardation is taken as a bullish sign, while going from backwardation to contango is generally considered bearish.
Author

Joshua Gibson
FXStreet
Joshua joins the FXStreet team as an Economics and Finance double major from Vancouver Island University with twelve years' experience as an independent trader focusing on technical analysis.

















