Dow Jones Industrial Average sheds 1K points from peak as Iran fears reignite
- The Dow Jones Industrial Average tumbled to start the week, sliding more than 1K points from Friday's intraday peak as a fresh round of US-Iran hostilities rattled risk sentiment.
- A drone strike on a petroleum site in the United Arab Emirates and the country's first missile alert since the April ceasefire reignited fears over the Strait of Hormuz.
- Oil prices surged, with WTI crude pushing back above $105 per barrel and Brent crossing above $114 as the US military's "Project Freedom" maritime escort operation got underway.
- Cruise operators and airlines led decliners while energy and defense names outperformed in a textbook geopolitical risk-off rotation.

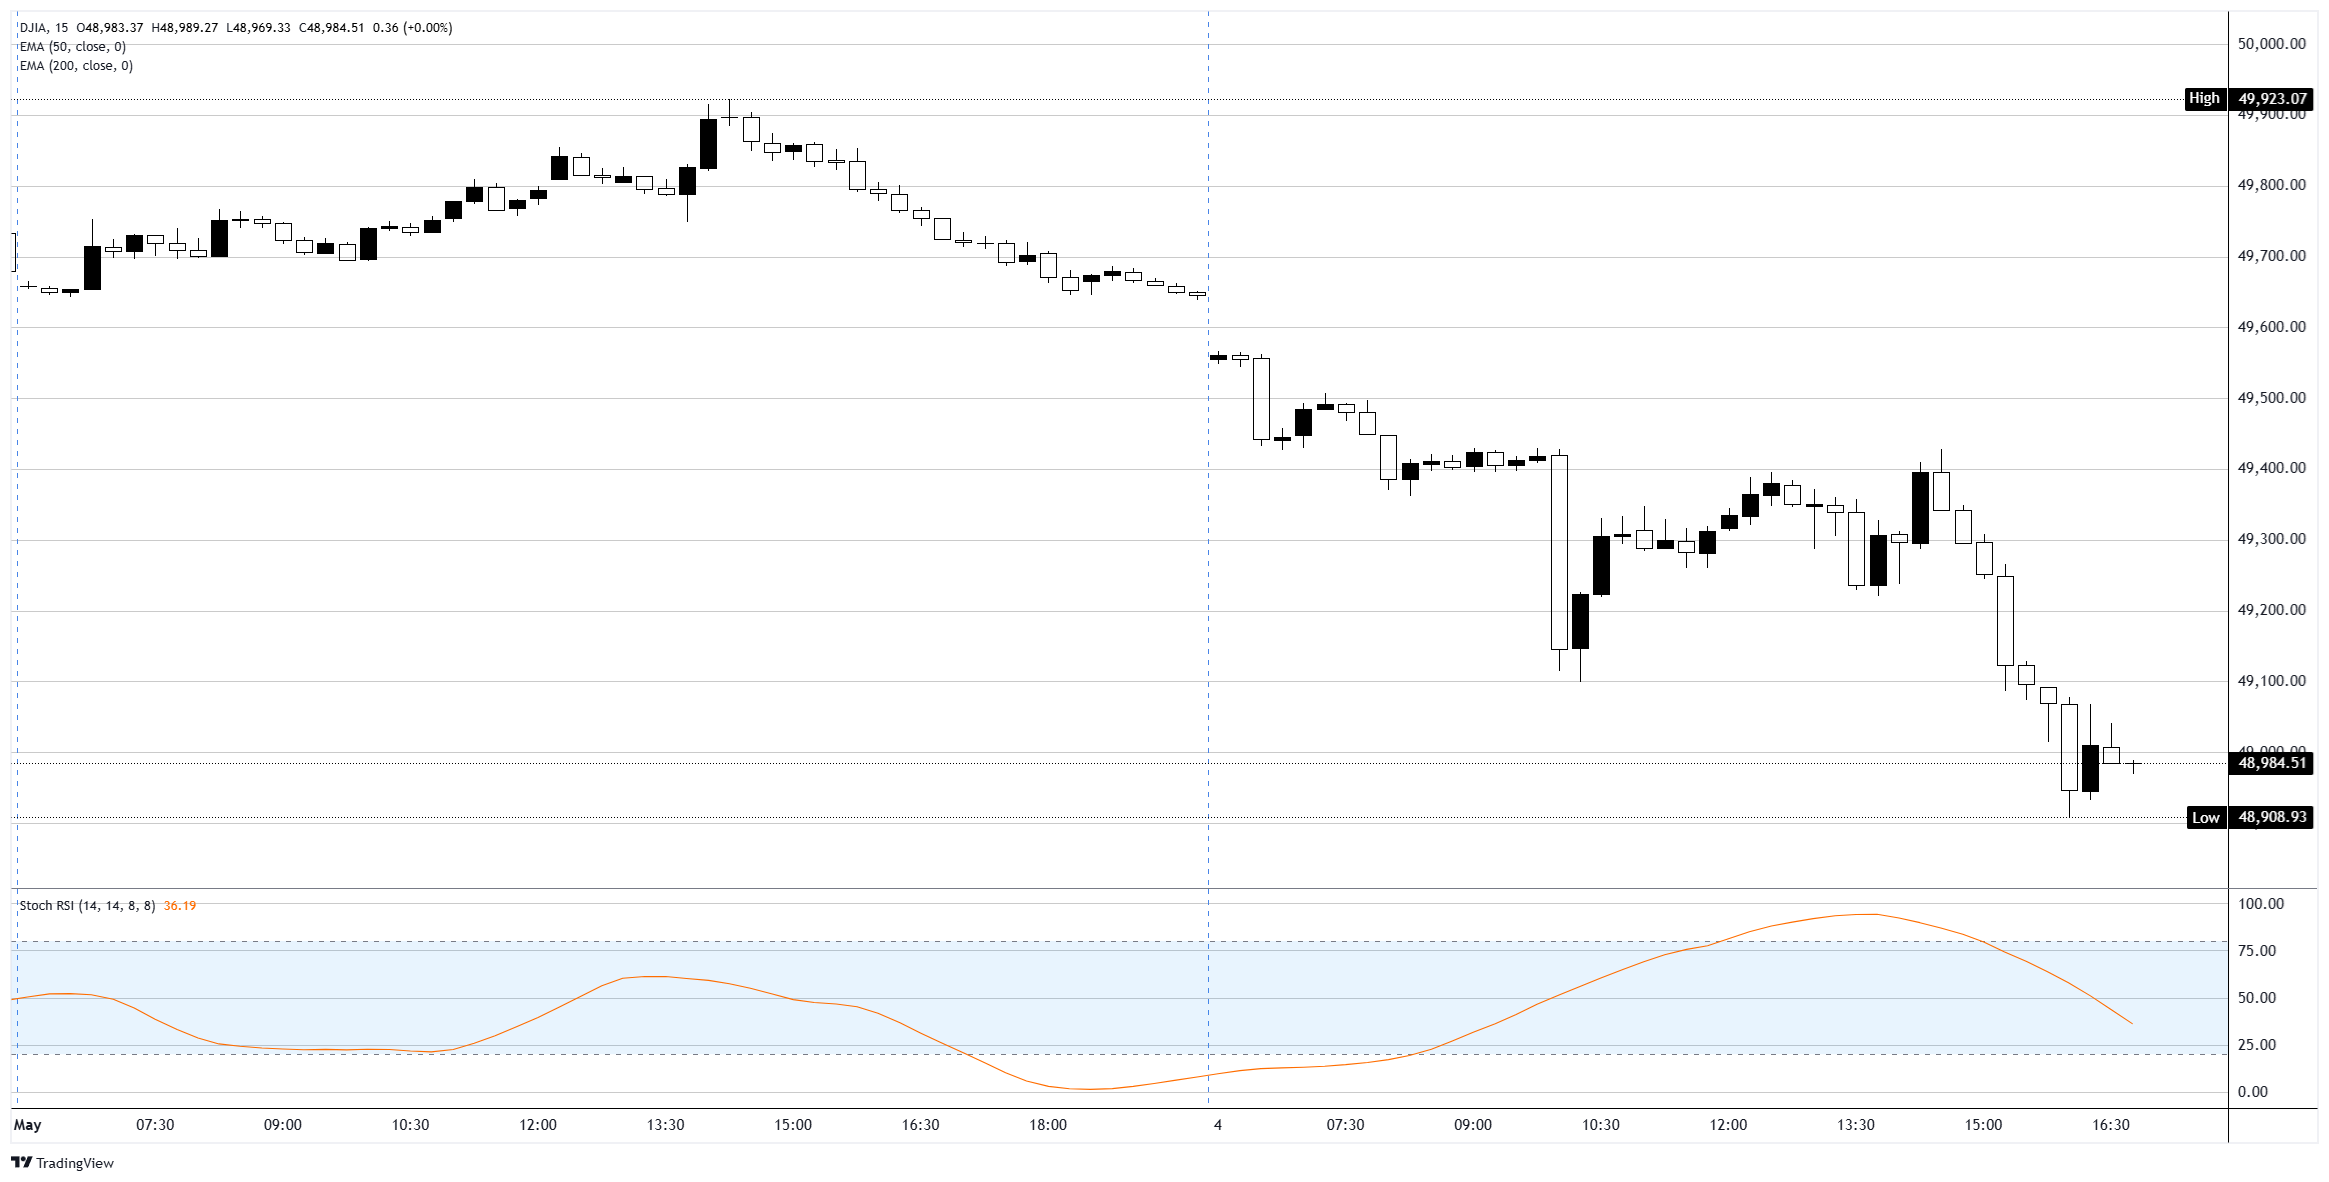
US equities slumped on Monday as a series of escalating reports out of the Persian Gulf revived concerns that the fragile US-Iran ceasefire is fraying. The Dow Jones Industrial Average (DJIA) shed roughly 0.9%, slipping back toward 49,000 after an intraday low below that level. The S&P 500 fell around 0.40% from Friday's record close above 7,200, while the Nasdaq Composite eased a similar 0.40% off its own all-time high. Cumulatively, the DJIA has now dropped more than 1K points from Friday's session peak near 49,900, putting a sizeable dent in last week's record-setting tape.
Iran tensions flare again
The selling kicked off in earnest after the United Arab Emirates (UAE) said its air defenses had engaged a salvo of cruise missiles and drones launched from Iran. The UAE Ministry of Defense reported four cruise missiles inbound, three intercepted over territorial waters and a fourth falling into the sea. A separate drone struck the Fujairah Petroleum Industries Zone, sparking a fire and lightly injuring three workers. It was the first time the UAE's missile alert system had been activated since the US-Iran ceasefire took hold in early April, and Emirati authorities reported a second wave of incoming projectiles within the hour. Notably, Fujairah sits on the Gulf of Oman, outside the Strait of Hormuz, making it one of the few Gulf export hubs that doesn't require transit through the contested chokepoint.
Strait of Hormuz back in focus
Energy prices were already grinding higher into the US session after Iranian state media claimed two missiles had hit a US warship near Jask Island in the Strait of Hormuz, allegedly after the vessel ignored warnings. A separate dispatch from Iran's Navy said it had turned back what it called American and Israeli warships from entering the zone. US Central Command rejected the reports outright, saying no US Navy ships had been struck and that two US-flagged merchant vessels had successfully transited the strait under Project Freedom, the maritime escort plan President Donald Trump unveiled Sunday. With both sides repeatedly contradicting each other and neither offering much in the way of independent verification, traders are increasingly treating Gulf headlines as signal-poor noise to be hedged against rather than parsed.
Oil surges, diplomatic backdrop sours
The reaction in Oil was sharper than the move in stocks. WTI crude rose roughly 3% to push above $105 per barrel, while Brent jumped over 5% to break above $114. Both benchmarks have now spent the better part of two weeks above $100, with ExxonMobil (XOM) CEO Darren Woods warning Friday that the market still hasn't priced in the full impact of the Hormuz blockade. Adding to the tension, an unconfirmed CNN source flagged expectations of further US or Israeli strikes on Iran within the next 24 hours. That follows Friday's news that Iran had sent an updated peace proposal through Pakistani mediators, an offer Trump publicly dismissed, suggesting Tehran was only at the table because its military capabilities had been depleted, a line that sits awkwardly against today's drone and missile barrage.
Risk-off rotation hits travel, lifts defense
Sector performance broke along familiar wartime lines. Cruise operators were among the day's hardest-hit names, with Norwegian Cruise Line (NCLH) sliding after the company missed first-quarter revenue estimates and trimmed its full-year outlook, citing Middle East-related itinerary disruptions. Airlines and hotel chains also leaned lower on the Oil spike. On the other side, energy majors and defense contractors caught a bid as investors rotated into the obvious geopolitical beneficiaries. Coinbase (COIN) bucked the broader tape, climbing on news that lawmakers had reached a deal on a key provision in pending crypto legislation, while Palantir (PLTR) ticked higher into its post-close earnings release. Advanced Micro Devices (AMD) eased ahead of its own results later this week after HSBC trimmed the chipmaker to a hold rating.
Week ahead: labor data and Big Tech earnings
Factory orders for March, released Monday morning, jumped 1.5% MoM, well above the 0.5% consensus and the strongest reading since November, helped by AI-driven demand for electronic components. The bigger event for rate watchers is the labor docket: Job Openings and Labor Turnover Survey (JOLTS) data, ADP private payrolls, weekly jobless claims, and Challenger job cuts are all on tap this week. Several Federal Reserve (Fed) speakers are also scheduled following last week's Federal Open Market Committee (FOMC) hold, with markets currently pricing in zero further moves through year-end. On the corporate side, AMD and Arm Holdings (ARM) report alongside Palantir and Paramount Skydance (PSKY), giving traders a meaningful read on AI capex momentum and consumer-facing tech demand.
Dow Jones 15-minute chart
Dow Jones FAQs
The Dow Jones Industrial Average, one of the oldest stock market indices in the world, is compiled of the 30 most traded stocks in the US. The index is price-weighted rather than weighted by capitalization. It is calculated by summing the prices of the constituent stocks and dividing them by a factor, currently 0.152. The index was founded by Charles Dow, who also founded the Wall Street Journal. In later years it has been criticized for not being broadly representative enough because it only tracks 30 conglomerates, unlike broader indices such as the S&P 500.
Many different factors drive the Dow Jones Industrial Average (DJIA). The aggregate performance of the component companies revealed in quarterly company earnings reports is the main one. US and global macroeconomic data also contributes as it impacts on investor sentiment. The level of interest rates, set by the Federal Reserve (Fed), also influences the DJIA as it affects the cost of credit, on which many corporations are heavily reliant. Therefore, inflation can be a major driver as well as other metrics which impact the Fed decisions.
Dow Theory is a method for identifying the primary trend of the stock market developed by Charles Dow. A key step is to compare the direction of the Dow Jones Industrial Average (DJIA) and the Dow Jones Transportation Average (DJTA) and only follow trends where both are moving in the same direction. Volume is a confirmatory criteria. The theory uses elements of peak and trough analysis. Dow’s theory posits three trend phases: accumulation, when smart money starts buying or selling; public participation, when the wider public joins in; and distribution, when the smart money exits.
There are a number of ways to trade the DJIA. One is to use ETFs which allow investors to trade the DJIA as a single security, rather than having to buy shares in all 30 constituent companies. A leading example is the SPDR Dow Jones Industrial Average ETF (DIA). DJIA futures contracts enable traders to speculate on the future value of the index and Options provide the right, but not the obligation, to buy or sell the index at a predetermined price in the future. Mutual funds enable investors to buy a share of a diversified portfolio of DJIA stocks thus providing exposure to the overall index.
Author

Joshua Gibson
FXStreet
Joshua joins the FXStreet team as an Economics and Finance double major from Vancouver Island University with twelve years' experience as an independent trader focusing on technical analysis.

















