Dow Jones Industrial Average holds as investors bank on another tariff delay
- The Dow Jones is holding near 44,400, albeit with a jittery note.
- The Trump administration is back with a fresh round of tariff threats.
- Investors continue to bet that Donald Trump will find a reason to delay tariffs again.

The Dow Jones Industrial Average (DJIA) floated near the 44,400 region on Monday, holding steady in a near-term consolidation zone as global markets bet that a fresh round of tariff threats from President Donald Trump will be delayed, suspended, or otherwise trimmed once again.
New month, new tariff deadline
A new deadline for a wide swath of tariffs has been arbitrarily penciled in for August 1, following another delay of Trump’s “undelayable” reciprocal tariffs that were announced in April. On top of the Trump administration’s “liberation day” reciprocal tariffs, Trump is now threatening double-digit tariff increases on some of the US’s closest trading partners, including South Korea, Japan, Canada, and Mexico.
Most countries have already agreed to continue trade talks with the Trump team, but progress remains slow. Despite a near-constant stream of promises that solid trade deals are just around the corner, very little actual progress has been achieved. China has agreed to an agreement to make new trade terms in the future, and the UK and Vietnam remain the only two countries to have come to a trade agreement, although actual details of the trade deals remain limited.
Trade deals are easy to make, but difficult to deliver
Neither the US nor Vietnam appears to be in a rush to provide an actual explanation of what the trade deal will entail, other than a blanket 20% tariff on all Vietnamese exports to the US. The tentative trade arrangement also includes a 40% tariff on any goods the US decides have been “transshipped” through the Asian country.
Beginning on Tuesday, the next batch of key earnings reports will begin rolling out. Major banks, including JPMorgan Chase, will begin revealing their latest quarterly earnings reports. Also on the docket this week will be the latest round of US inflation data. US Consumer Price Index (CPI) inflation data through June is expected to accelerate as the first batch of tariffs that Trump successfully implemented begins to take hold on the US economy and leak through to headline datasets over the coming months.
Fed is wrong about rates and overspending, says deficit-laden Trump administration
The rift between the Trump administration and the Federal Reserve (Fed) continues to widen as Donald Trump pins all of his fiscal policy woes on Fed Chair Jerome Powell refusing to lower interest rates in the face of potential tariff inflation. Trump has ramped up his near-daily personal attacks on the Fed head via social media posts and media statements, which the Fed’s Powell has broadly ignored. Trump officials who helped pen and pass Donald Trump’s “big beautiful budget bill”, which is set to add trillions of dollars of excess government spending to the US deficit, are set to begin investigating the Fed’s spending on a revamp and renovation of the Fed’s main office building in Washington, DC.
Dow Jones price forecast
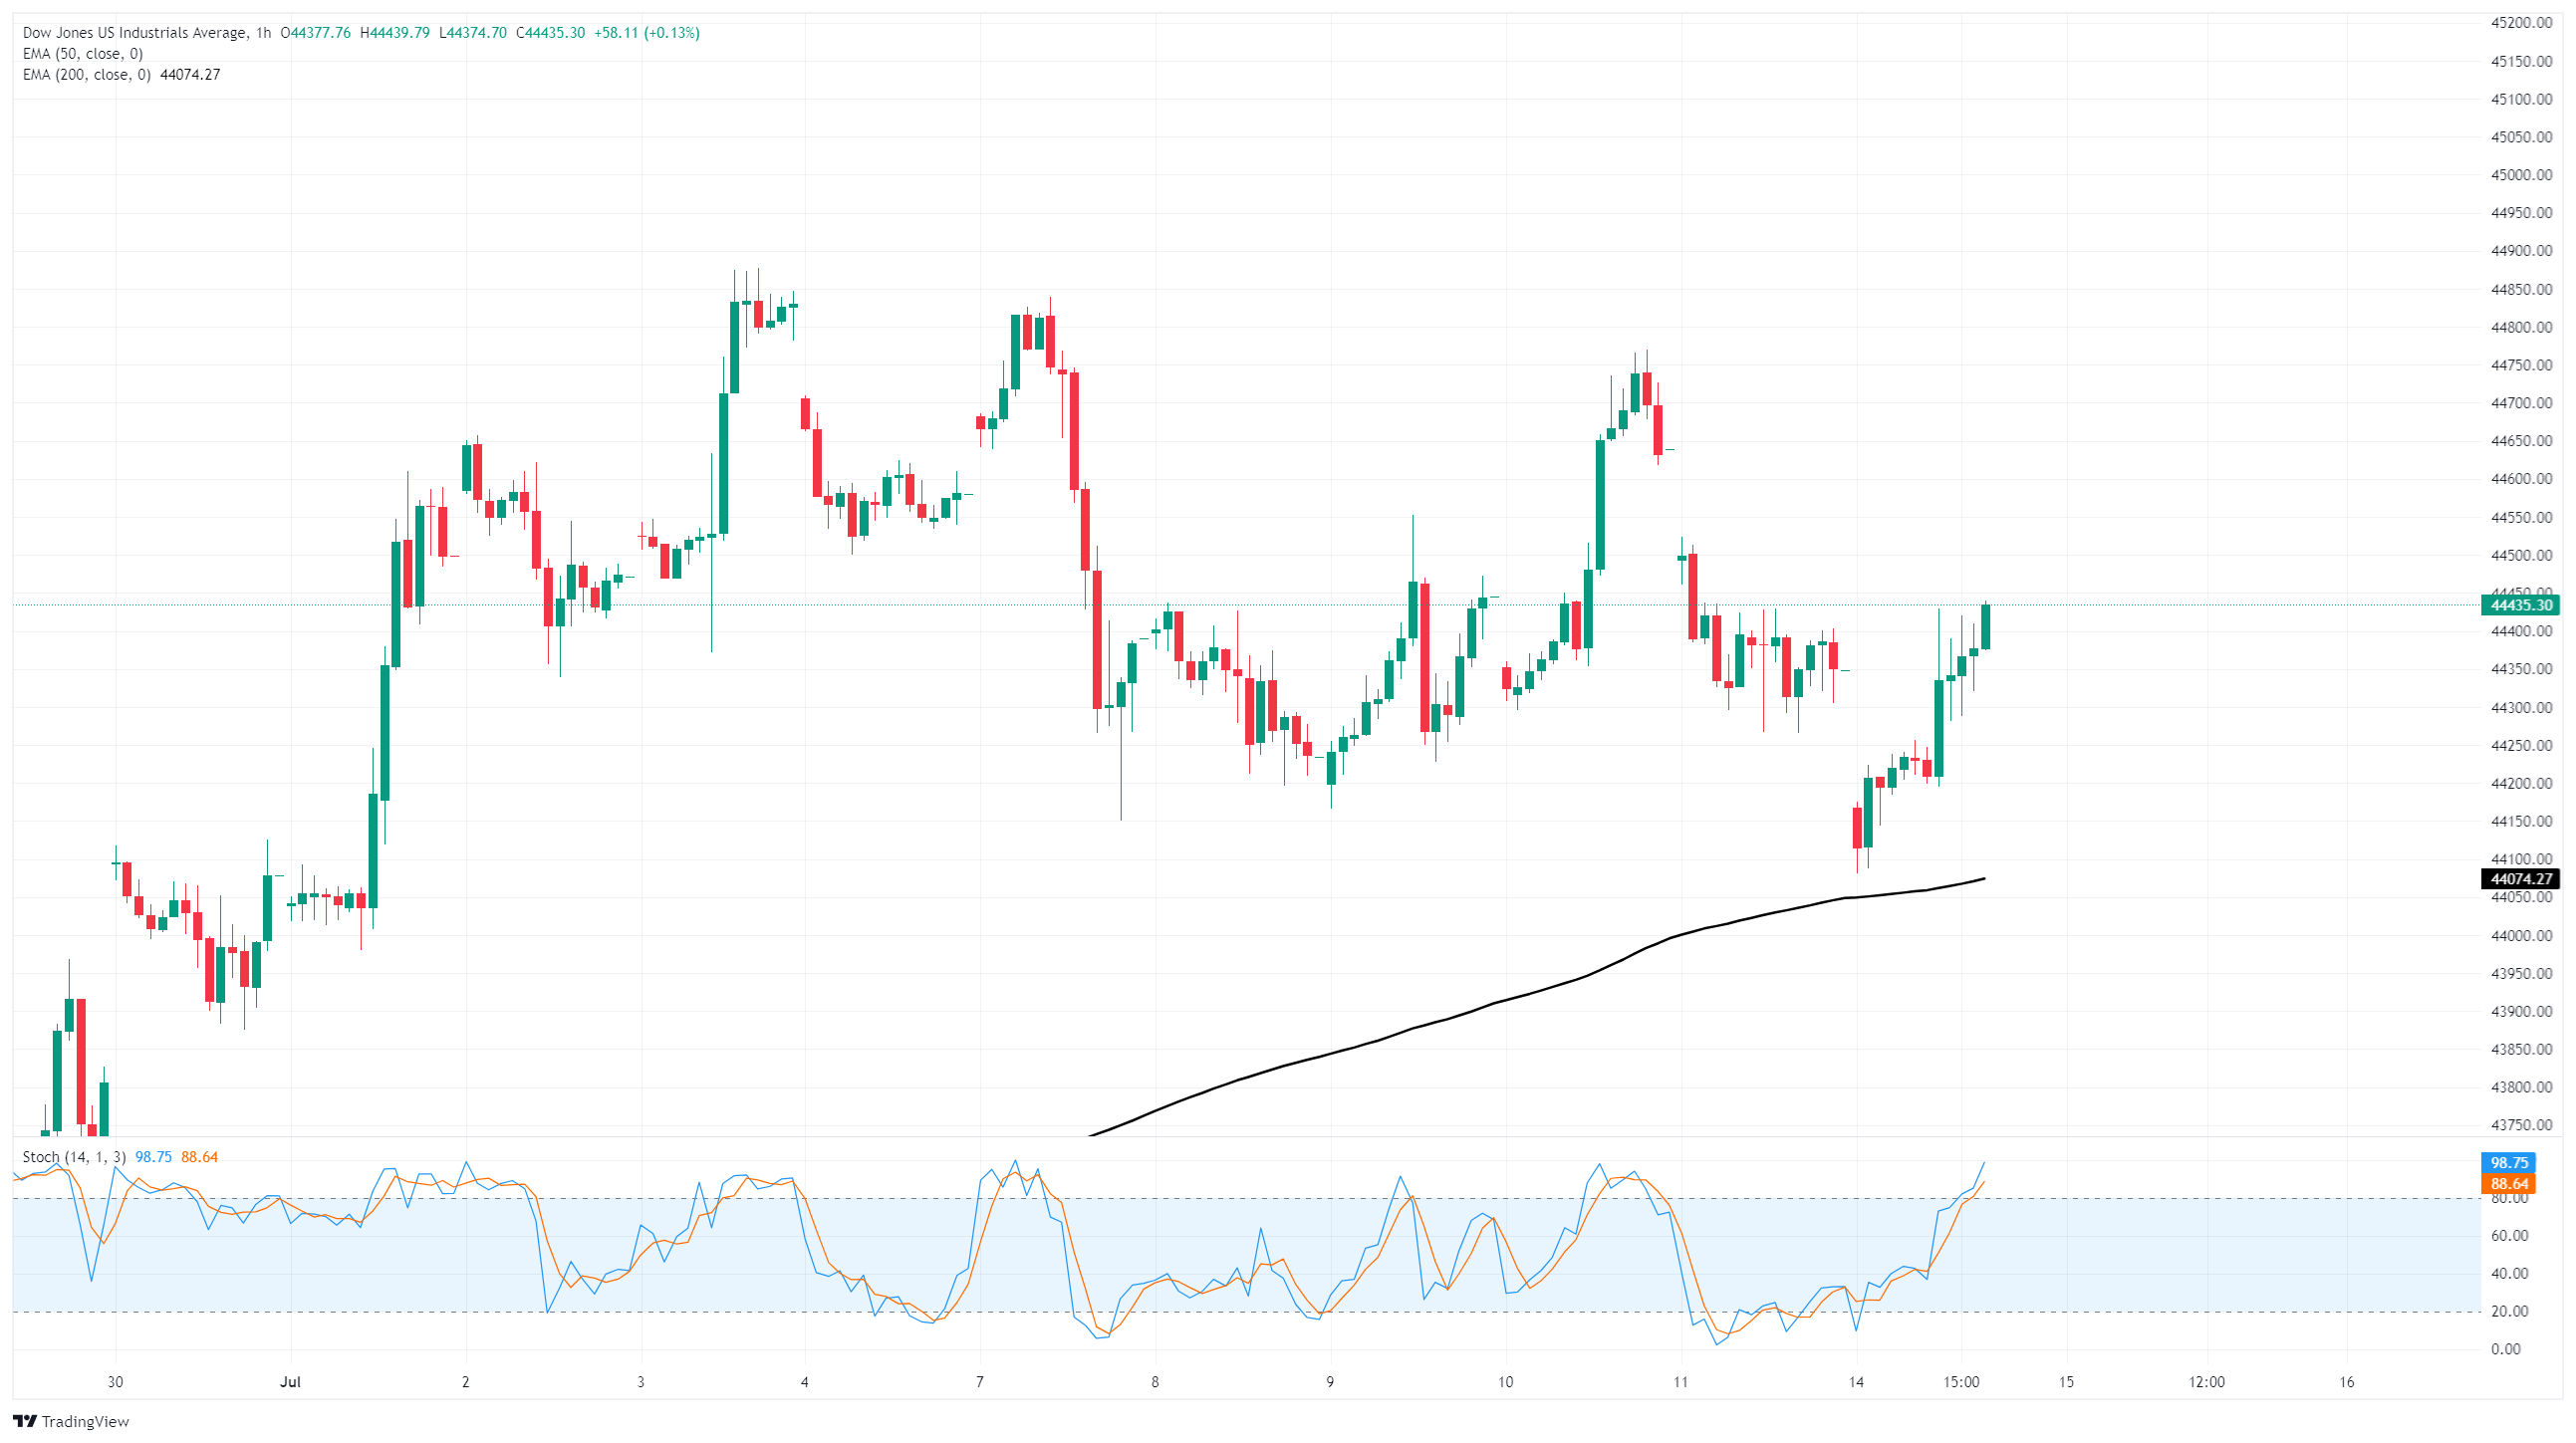
The Dow Jones continues to churn the chart paper in a rough consolidation zone, bouncing around the middle ground between the 45,000 and 44,000 handles. A slow grind lower has cropped up in intraday timeframes, pushing intraday swing lows back into median prices. However, overall bullish momentum remains strong, and stretches to the downside are likely to turn into buying opportunities rather than signals to sell further.
Dow Jones 1-hour chart
Dow Jones FAQs
The Dow Jones Industrial Average, one of the oldest stock market indices in the world, is compiled of the 30 most traded stocks in the US. The index is price-weighted rather than weighted by capitalization. It is calculated by summing the prices of the constituent stocks and dividing them by a factor, currently 0.152. The index was founded by Charles Dow, who also founded the Wall Street Journal. In later years it has been criticized for not being broadly representative enough because it only tracks 30 conglomerates, unlike broader indices such as the S&P 500.
Many different factors drive the Dow Jones Industrial Average (DJIA). The aggregate performance of the component companies revealed in quarterly company earnings reports is the main one. US and global macroeconomic data also contributes as it impacts on investor sentiment. The level of interest rates, set by the Federal Reserve (Fed), also influences the DJIA as it affects the cost of credit, on which many corporations are heavily reliant. Therefore, inflation can be a major driver as well as other metrics which impact the Fed decisions.
Dow Theory is a method for identifying the primary trend of the stock market developed by Charles Dow. A key step is to compare the direction of the Dow Jones Industrial Average (DJIA) and the Dow Jones Transportation Average (DJTA) and only follow trends where both are moving in the same direction. Volume is a confirmatory criteria. The theory uses elements of peak and trough analysis. Dow’s theory posits three trend phases: accumulation, when smart money starts buying or selling; public participation, when the wider public joins in; and distribution, when the smart money exits.
There are a number of ways to trade the DJIA. One is to use ETFs which allow investors to trade the DJIA as a single security, rather than having to buy shares in all 30 constituent companies. A leading example is the SPDR Dow Jones Industrial Average ETF (DIA). DJIA futures contracts enable traders to speculate on the future value of the index and Options provide the right, but not the obligation, to buy or sell the index at a predetermined price in the future. Mutual funds enable investors to buy a share of a diversified portfolio of DJIA stocks thus providing exposure to the overall index.
Author

Joshua Gibson
FXStreet
Joshua joins the FXStreet team as an Economics and Finance double major from Vancouver Island University with twelve years' experience as an independent trader focusing on technical analysis.

















